API Monitoring Best Practices Every Developer Should Know
19 min read
Loading...
Meta description: Learn API monitoring best practices beyond status codes, including content validation, response-time trends, sensible incident alerting thresholds and CI/CD integration.
Checking for a 200 status code isn't really API monitoring. It's a pulse check. It tells you the patient is breathing, nothing more. Real API monitoring validates response content and structure, tracks response-time trends so you catch slow degradation before it turns into a full outage, and layers checks with sensible thresholds so your incident alerts flag actual problems instead of noise. Build this into your CI/CD pipeline and you'll catch issues before your users do, not after your support inbox fills up.
I've talked to a lot of developers who set up a basic health check years ago, watched it turn green, and never touched it again. Then one day the checkout API starts returning empty carts. The health check is still happily green. Nobody notices until customers start complaining. Let's fix that with practical configuration advice, not just theory.
APIs fail in ways that websites don't. A broken webpage usually announces itself: a blank screen, a 500 error, a scary-looking stack trace. APIs are quieter. They can return a perfectly polite 200 status code while handing back an empty array, a null object or a JSON response that technically parses but contains none of the data your application needs.
To be precise about that status code: a 200 means the server successfully processed the request and returned a response. It doesn't mean the request was merely "accepted" (that's what a 202 is for, when processing happens asynchronously). A 200 confirms the transport succeeded. It says nothing about whether the payload is correct.
It helps to think about API monitoring in layers, because each layer catches a different class of failure:
| Check type | What it confirms | What it misses |
|---|---|---|
| Website uptime check | The page loads and the server responds | Broken API calls behind the page or incorrect data |
| API availability check | The endpoint returns a status code within an acceptable time | Empty, stale or malformed data inside a valid response |
| API correctness check | The response matches an expected schema or field value | Business-level failures, such as the wrong price being applied |
| Synthetic business transaction | A full user flow, such as login → add to cart → checkout, completes correctly | Failures outside that specific flow |
Most teams stop at the first or second row. The real value, and the real protection for your users, comes from building out the third and fourth.
This matters even more when you depend on third-party services. Payment gateways, authentication providers and shipping APIs can degrade silently. The endpoint responds, the connection succeeds, but the data coming back is stale, incomplete or subtly wrong. Your users notice long before your monitoring does if it only checks whether the server responded.
Public-facing APIs aren't the only ones that need monitoring. Internal microservices need it too, even when they never receive an external request. A queue processor, internal pricing service or scheduled data synchronisation job can fail quietly for hours because nobody is actively watching it. There's often no user complaint to trigger an investigation, because there's no user in the loop at all.
If you operate infrastructure for UK or EU customers, data residency also matters. Where you run monitoring checks from, and where response data gets logged, can have GDPR implications if synthetic tests touch anything resembling personal data. Running checks from UK or EU-based monitoring locations, and keeping monitoring logs within the same jurisdiction as your production data, is worth confirming with your chosen tool and your legal or compliance team.
The question should not be "is it up?" That's the wrong frame. The real question is: is it doing what it's supposed to do, correctly and quickly, right now? That's a fundamentally different monitoring problem and needs a different approach.
The short answer is no. A 200 status code tells you the server successfully returned a response. That's useful information, but it's the floor, not the ceiling, of API monitoring.
Here are a few ways a 200 response can still mean your API is broken:
{"products": []} when it should return dozens of products.{"error": "database timeout"} sails through a basic uptime check.Let's make that checkout scenario from earlier concrete. During a database failover, the API kept returning 200 responses, but the body looked like this:
{
  "status": "ok",
  "cart": {
    "items": [],
    "total": 0
  }
}
A plain status-code check sees 200 and moves on. A proper assertion would catch this immediately:
assert response.status_code == 200
assert len(response.json["cart"]["items"]) > 0
assert response.json["cart"]["total"] > 0
That's the difference between availability monitoring and correctness monitoring, in about three lines. Customers hit "complete purchase" and got nothing: no error, no crash, just a quiet failure. The uptime dashboard stayed green throughout. This is exactly the kind of failure dedicated API monitoring exists to prevent.
The fix is to layer your checks:
That third layer is where a lot of basic monitoring setups fall short. Moonitor includes keyword monitoring as one of its core monitor types, which is a useful lightweight option: you set up a check that looks for a specific keyword, field or value in the response body and get alerted when it's missing. That said, keyword checking is a text-matching fallback, not full schema validation. If you need to confirm that total is a positive number, items is a non-empty array and status is one of three allowed values, use JSON Schema or JSONPath-style assertions rather than a substring search. Keyword checks are fine for quick wins on less critical endpoints. Save the proper schema validation for anything involving money, authentication or user data.
A single slow response is often just noise. Maybe there was a brief network problem, a garbage-collection pause, a short-lived traffic spike. What matters is the trend underneath, and specifically what's happening at the tail of your latency distribution, not just the average.
This is where p95 and p99 latency become useful. Your average response time might look healthy at 120 ms while your 95th percentile has risen from 400 ms to 900 ms over three weeks. That gap, between what most requests experience and what your slowest requests experience, is often an early warning sign, because it shows a subset of requests struggling before the whole system tips over.
A practical rule is to set a warning threshold at roughly 1.5 times your 30-day p95 baseline, and a critical or paging threshold at around twice that baseline, sustained across several consecutive checks. So if your checkout endpoint's p95 has been 400 ms for a month, a warning at 600 ms and a page at 800 ms, held for three consecutive checks, gives you room to investigate before it becomes an emergency. These figures are illustrative: your actual thresholds should come from historical data and your internal service-level objective (SLO), not be copied wholesale from a blog post.
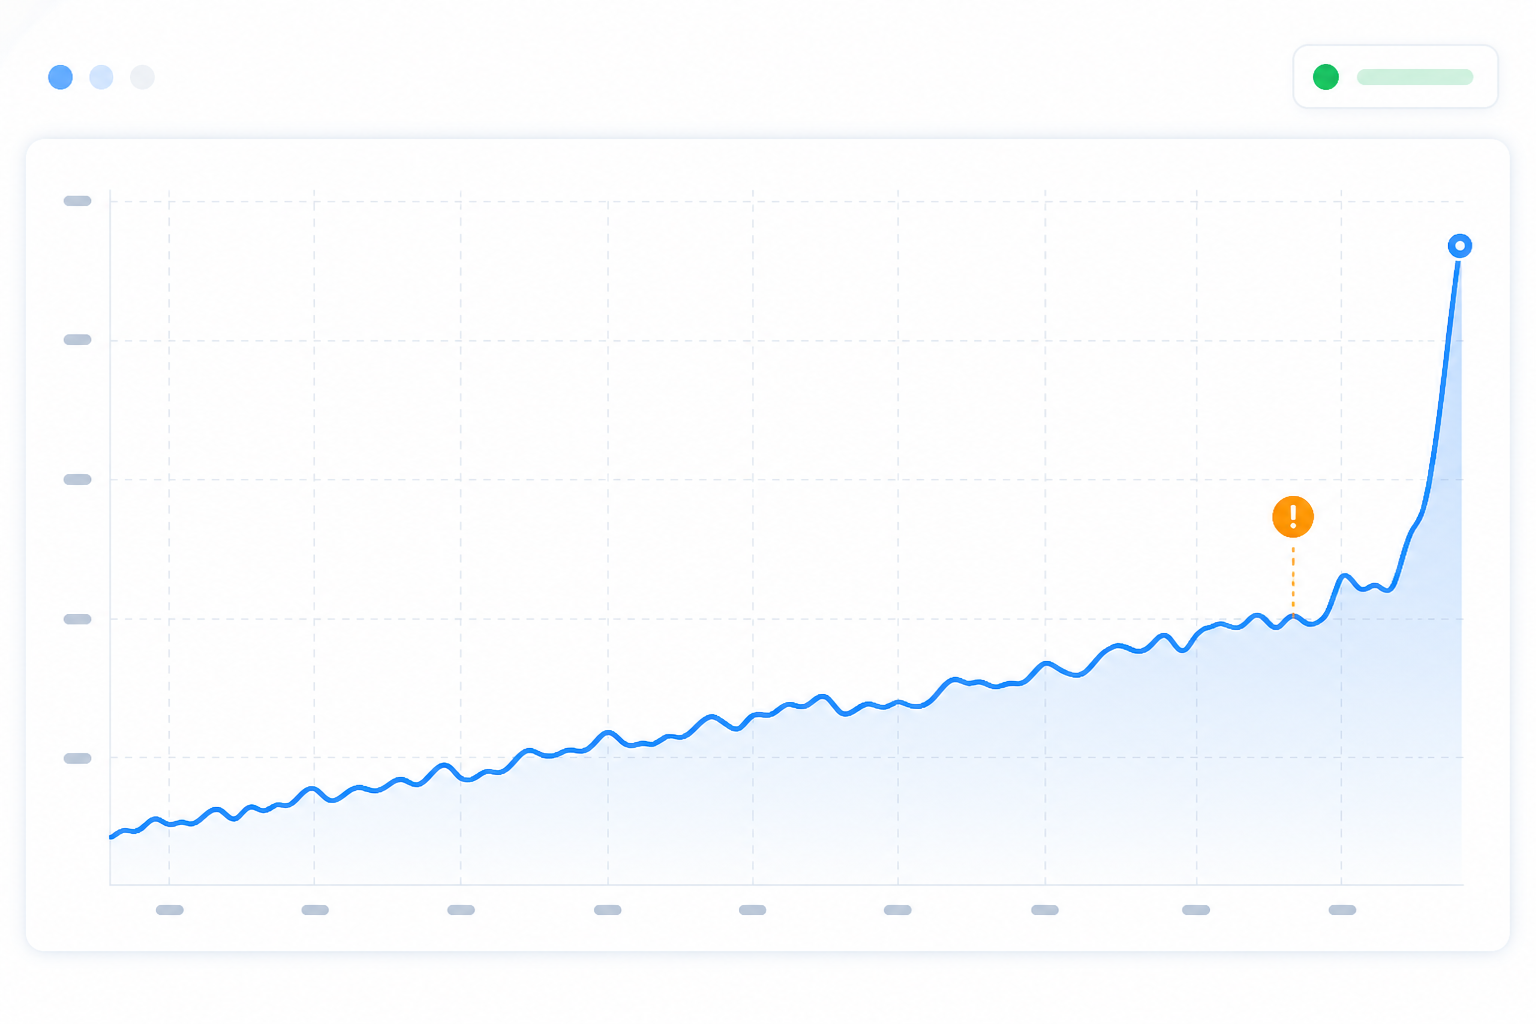
A common pattern is for response times to creep up gradually over days or weeks. Nobody notices because each individual check still passes within a basic threshold. Then, seemingly out of nowhere, the system tips into an outage. It wasn't sudden at all, it had been building the whole time. Slow degradation often comes from a handful of familiar causes:
None of these necessarily look like a hard failure until they suddenly are. That's why it's worth reviewing response-time analytics weekly, not just when an alert fires. Look at the p95 trend line, not the current number or average in isolation. If Tuesday's p95 was 400 ms and this Tuesday it's 900 ms, that's worth digging into, even though every individual check technically passed.
Set baseline expectations for each endpoint separately. A 50 ms authentication check and a two-second report-generation endpoint shouldn't share the same alert threshold. One blanket threshold across your entire API will either create false alarms on fast endpoints or hide real degradation in naturally slower ones. Base your thresholds on each endpoint's own historical p95, not a single number applied everywhere.
Once status codes and response time are covered, content validation is the next layer, and often the one that catches the failures that actually hurt users. This is also where keyword searching and structural validation start to diverge, so it's worth being specific about the levels available to you.
Level 1 — Keyword presence. Confirm that a string or field name appears somewhere in the response. Quick to set up, and it catches obvious failures like a field disappearing entirely, but it tells you nothing about type or value correctness.
Level 2 — Field and type assertions. Confirm that specific fields exist and have the correct type. For example:
{
  "status": "ok",
  "orderId": "ORD-88213",
  "total": 42.50,
  "items": [{"sku": "AB123", "qty": 2}]
}
A reasonable set of assertions would check that orderId is a non-null string matching the expected pattern, total is a positive number, and items is a non-empty array. That's a meaningfully stronger guarantee than just checking whether the word "ok" shows up somewhere.
Level 3 — Schema and business-rule validation. Validate the full response against a JSON Schema, then stack business rules on top. For example: status must be one of ['ok', 'pending', 'failed']; total must equal the sum of the line items; orderId must match a known format. This catches the kind of failures a human would spot during a manual review, except it happens automatically and continuously.
Level 4 — Response-size checks. Confirm the response size falls within an expected range. A truncated payload can look fine at a glance while missing half its data, and a size check can catch that quickly without parsing the whole structure. Treat it as a useful supplementary signal, not a replacement for schema validation.
Level 5 — Multi-region checks, used carefully. Checking from more than one location helps you tell the difference between "my API is down" and "one monitoring node had a bad network route." That said, requiring every region to agree before alerting reduces false positives but can also delay or hide a genuine regional outage. A better default is region-aware severity: page immediately on a global failure, but route a single-region failure to a lower-urgency channel for investigation rather than suppressing it entirely. If you serve UK or EU customers, make sure at least one check location is actually in that region. A US-only monitoring setup can easily miss a UK-specific routing or CDN issue.
A lot of homegrown monitoring setups check status codes reliably but never build content validation, because it feels like extra work. It isn't extra. It's the part that actually protects users from silent failures.
Alert fatigue is real, and it's genuinely dangerous. If your team gets paged for every minor blip, people start tuning out alerts, and eventually they miss the one that matters. Effective incident alerting has less to do with picking clever numbers and more to do with applying a consistent decision framework.
Use a severity matrix like this as a starting point:
| Scope | Duration | User impact | Suggested response |
|---|---|---|---|
| Single region | Under 2 minutes | Low | Log only; no alert |
| Single region | Over 5 minutes | Medium | Warning to Slack or Discord |
| All regions | Any duration | High, such as checkout, authentication or payments | Immediate page |
| All regions | Over 5 minutes | Medium, such as internal tools | Warning; escalate if sustained |
A few principles support a matrix like this:
Getting this right takes some iteration, but it builds trust. When an alert fires, you want your team to believe it, not shrug it off.
API monitoring shouldn't be something you bolt on after deployment and forget about. It works best woven directly into your CI/CD pipeline. A sequence like this works well:
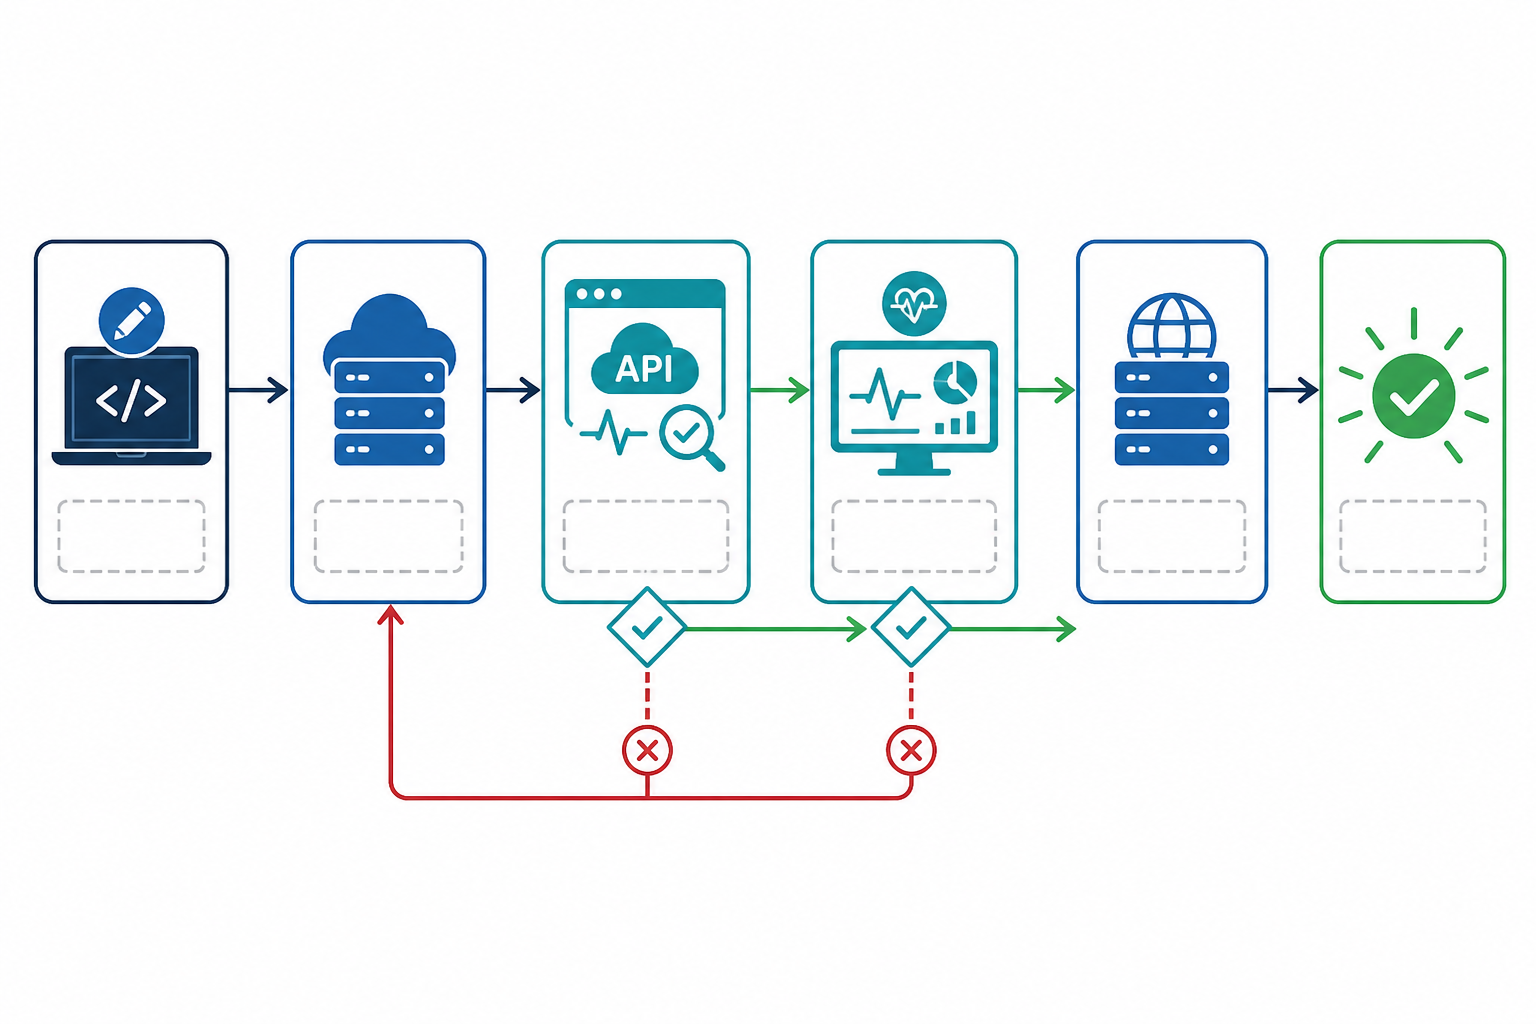
This is where API monitoring stops being a passive dashboard and becomes an active part of how you ship software safely.
API monitoring rarely operates in isolation, and it shouldn't. Pair it with related checks and make ownership clear:
Here's a practical checklist, ordered by how soon you should tackle each piece:
Do this today:
Do this week:
Mature over the next month:
None of this has to happen all at once. Start with content validation on your most important endpoint and build out from there.
No. A 200 status code confirms that the server successfully returned a response, but it says nothing about whether that response is correct. APIs can return 200 with empty data, stale cache content, or error messages embedded in the body. Use content and structure validation, including field checks, type checks, or full JSON Schema validation, alongside status-code and latency checks.
Use a monitoring tool that records response times for every check and gives you historical percentile analytics, particularly p95 and p99, rather than just an average or current status. Set a warning threshold at roughly 1.5 times your 30-day p95 baseline and a paging threshold at around twice that, sustained across several consecutive checks. Trends often flag database, memory, or connection-pool problems earlier than a single slow request ever will.
Layer your checks by importance: keyword presence for a quick sanity check, field and type assertions for moderately important endpoints, and full JSON Schema or business-rule validation for anything touching money, authentication, or user data. For critical endpoints, validate expected values, like status: "ok" rather than "degraded", and check that response size falls within a normal range. That catches truncated or corrupted payloads that keyword checks alone would miss.
Uptime monitoring typically checks whether a website or server is reachable. API monitoring goes further: it validates response content and structure, tracks latency per endpoint, and simulates authenticated requests or specific payloads to reflect how real clients actually use the API.
For customer-facing or revenue-critical APIs, checks every 30–60 seconds are common. Internal or lower-priority endpoints can go every few minutes. The right interval depends on how quickly a failure would affect users, your monitoring budget, and whether the endpoint is stateful enough that frequent synthetic checks could create noisy test data.
Use a dedicated service account or API key scoped to only what the check needs, never a real customer's credentials. Keep test transactions idempotent so they can run repeatedly without side effects. A synthetic "place order" check should use a sandbox environment or a clearly marked test SKU that gets purged automatically, so monitoring doesn't pollute production analytics or billing.
Yes. Requiring every region to agree before alerting reduces noise from a flaky network hop, but it can also delay or hide a genuine region-specific outage, which matters a lot if a significant share of your users live in that region. A better approach is region-aware severity: page immediately on a global failure, and route single-region failures to a lower-urgency channel rather than suppressing them entirely.

Discover how agencies centralise API monitoring, manage dozens of client sites, automate uptime reports, and launch a branded status page for clients.
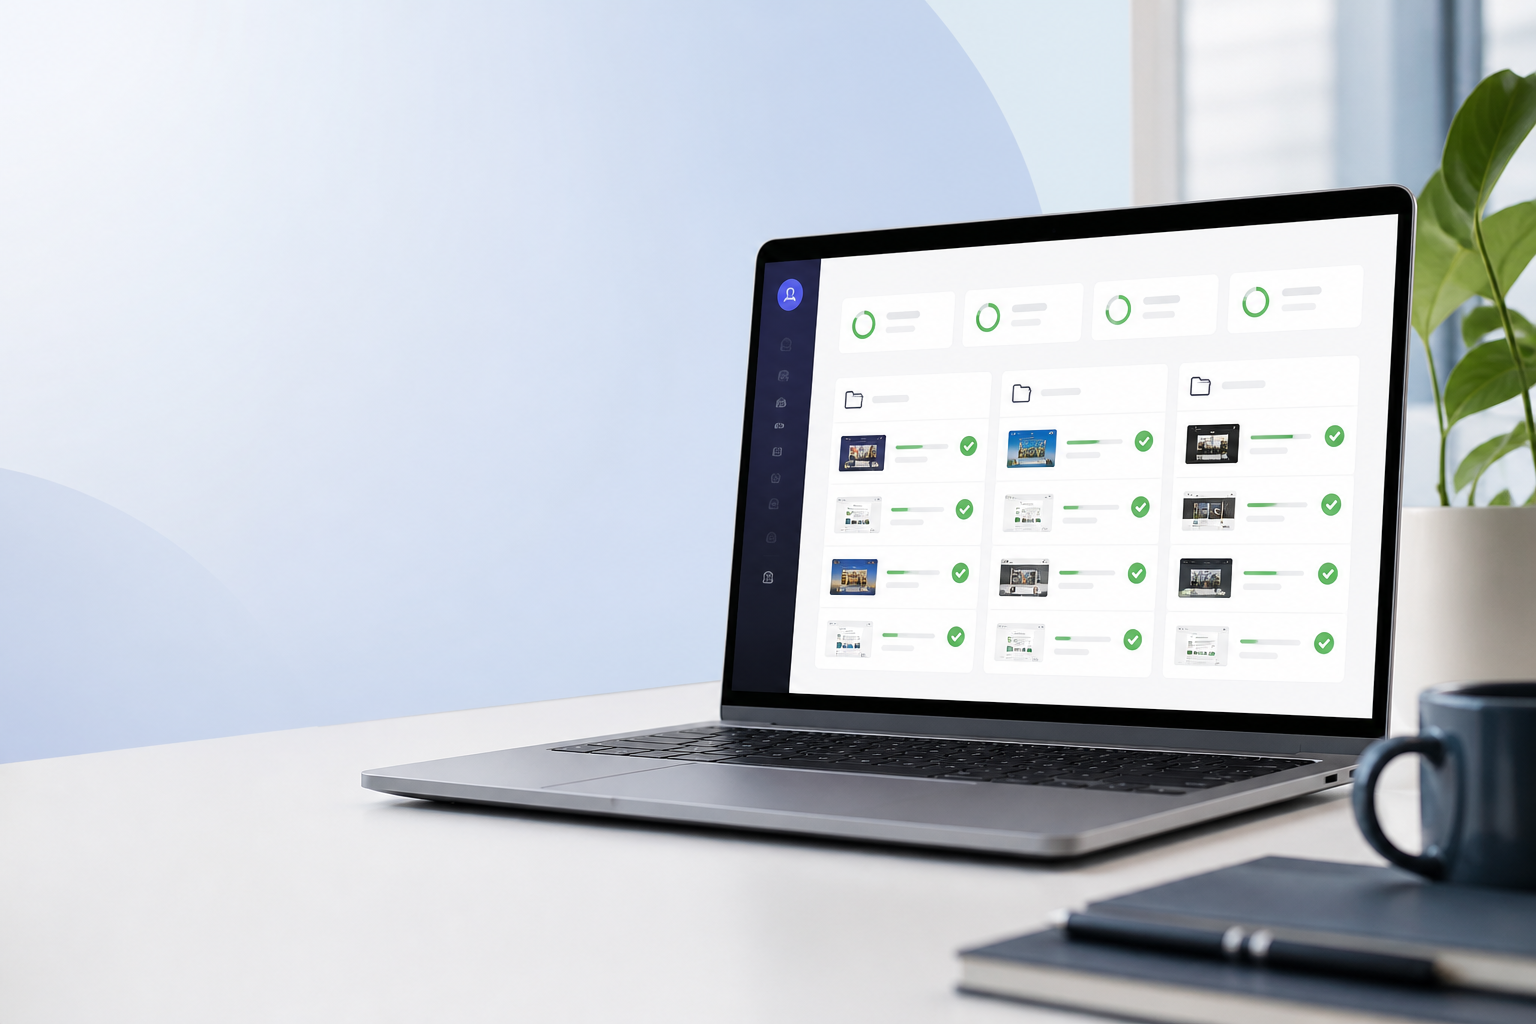
Agency uptime monitoring for UK client sites: organise alerts, track performance and report uptime professionally from one centralised dashboard.
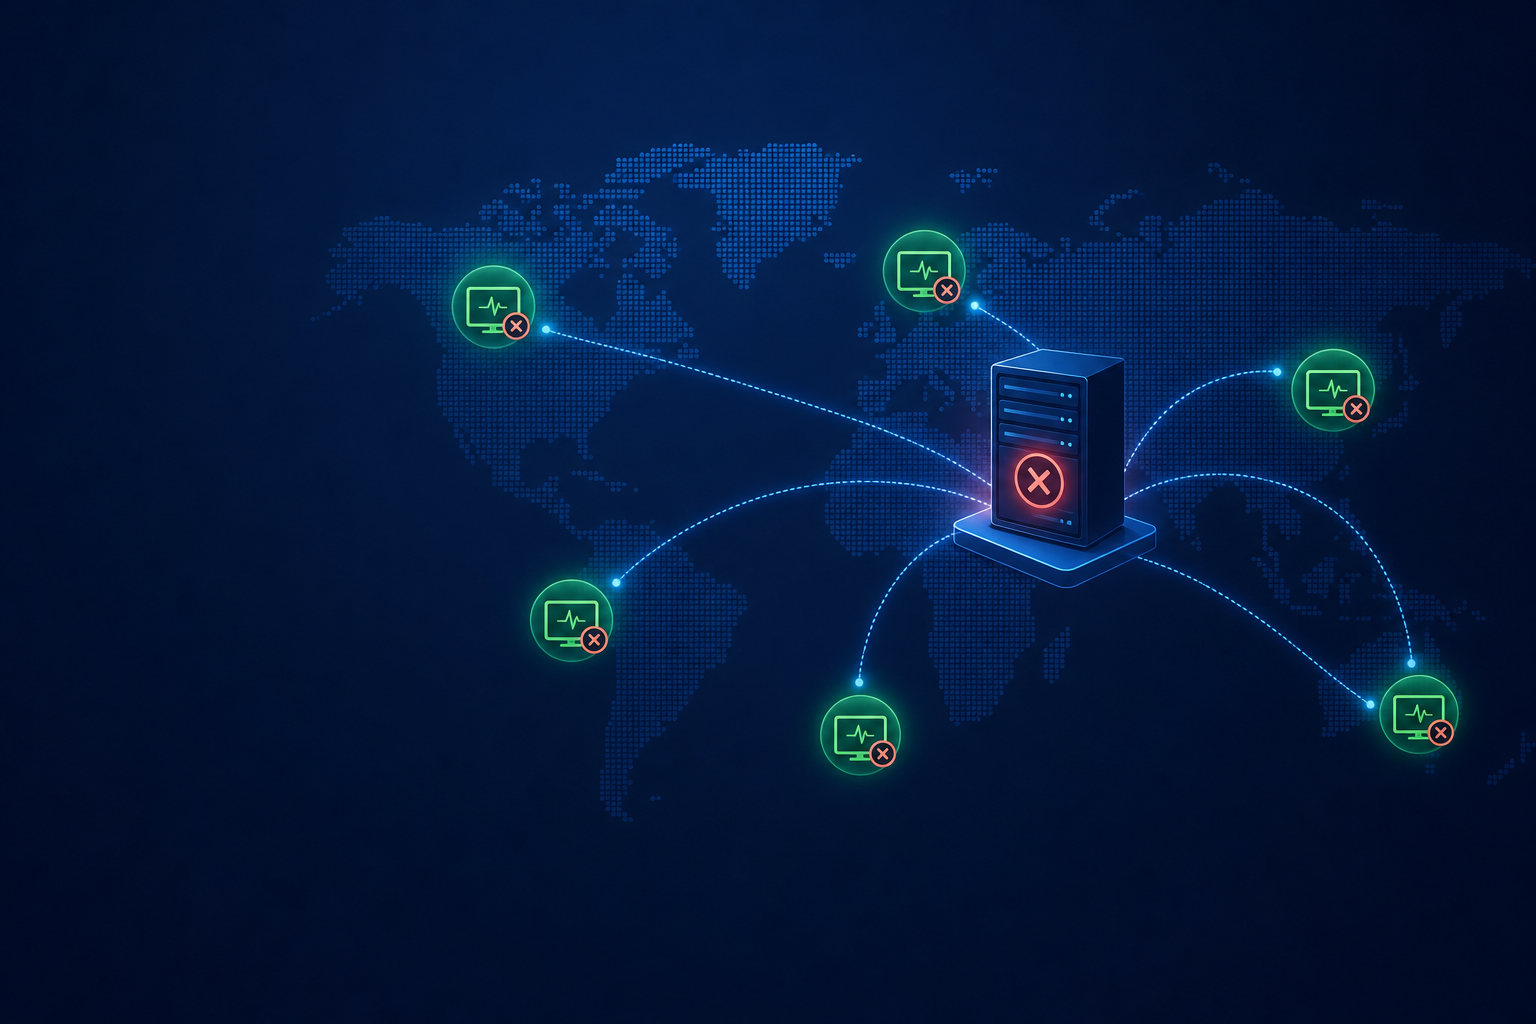
Learn how multi-region monitoring strengthens uptime monitoring, cuts false positives and improves incident alerting—while revealing limits reliability.