How to Put AI Visibility Data in Your Next Leadership QBR: A Template-Style Guide
18 min read
Loading...

If you have one slide's worth of attention from your leadership team, spend it on three things: your visibility score, your AI share of voice against named competitors, and the quarter-on-quarter trend. That is the core of good AI visibility reporting. My recommended board summary is three slides: (1) the headline, with score, share of voice and trend together; (2) competitors and platforms; and (3) cautious pipeline context with clear next actions. The working QBR is a six-slide expansion of the same story, with the trend on its own slide and the content split into more detail. I map the two formats below so nobody ends up comparing different decks. Report monthly to the working team and quarterly to the board. AI answers fluctuate from one run to the next, and only aggregated trends are stable enough to support executive decisions.
The rest of this guide is a template-style walkthrough: which AI search KPIs deserve a place in front of executives, how to define them so they survive scrutiny, how to chart the data, and how to connect it to pipeline without overclaiming. I have written it as an analyst who has to defend every number in the room. 📊
In my experience, executive questions about AI search come down to three:
A good QBR answers them in that order, because each depends on the one before it. You cannot discuss revenue influence until you have established presence, and presence means little until you know how you compare with rivals.
The case for measuring AI visibility rests on company-reported figures, independent research and forecasts. I would keep those three categories visibly separate on any slide. All of the sources below are international or US-based, so treat them as context, not a proxy for UK buyer behaviour.
I have no reliable UK-wide figure for how many B2B or consumer buyers ask ChatGPT, Claude, Gemini, Copilot or Perplexity for shortlists, and I would be wary of anyone who claims one. The pragmatic route is to measure your own market. Add a 'did you use an AI assistant?' question to sales discovery calls and forms, and report the result next to the external context.
Here is the sentence I use with chief executives:
'It measures how often, and how favourably, AI assistants mention and recommend us when buyers ask the questions that precede a purchase.'
Pair it with an analogy they already understand. Share of shelf in retail, or share of voice in traditional media, lands far better than a phrase like generative engine optimisation. Then set expectations: this is a new measurement discipline, and the data is directional, not audited. Saying so up front builds credibility. An executive who discovers the limitations unaided will discount everything else you have presented.
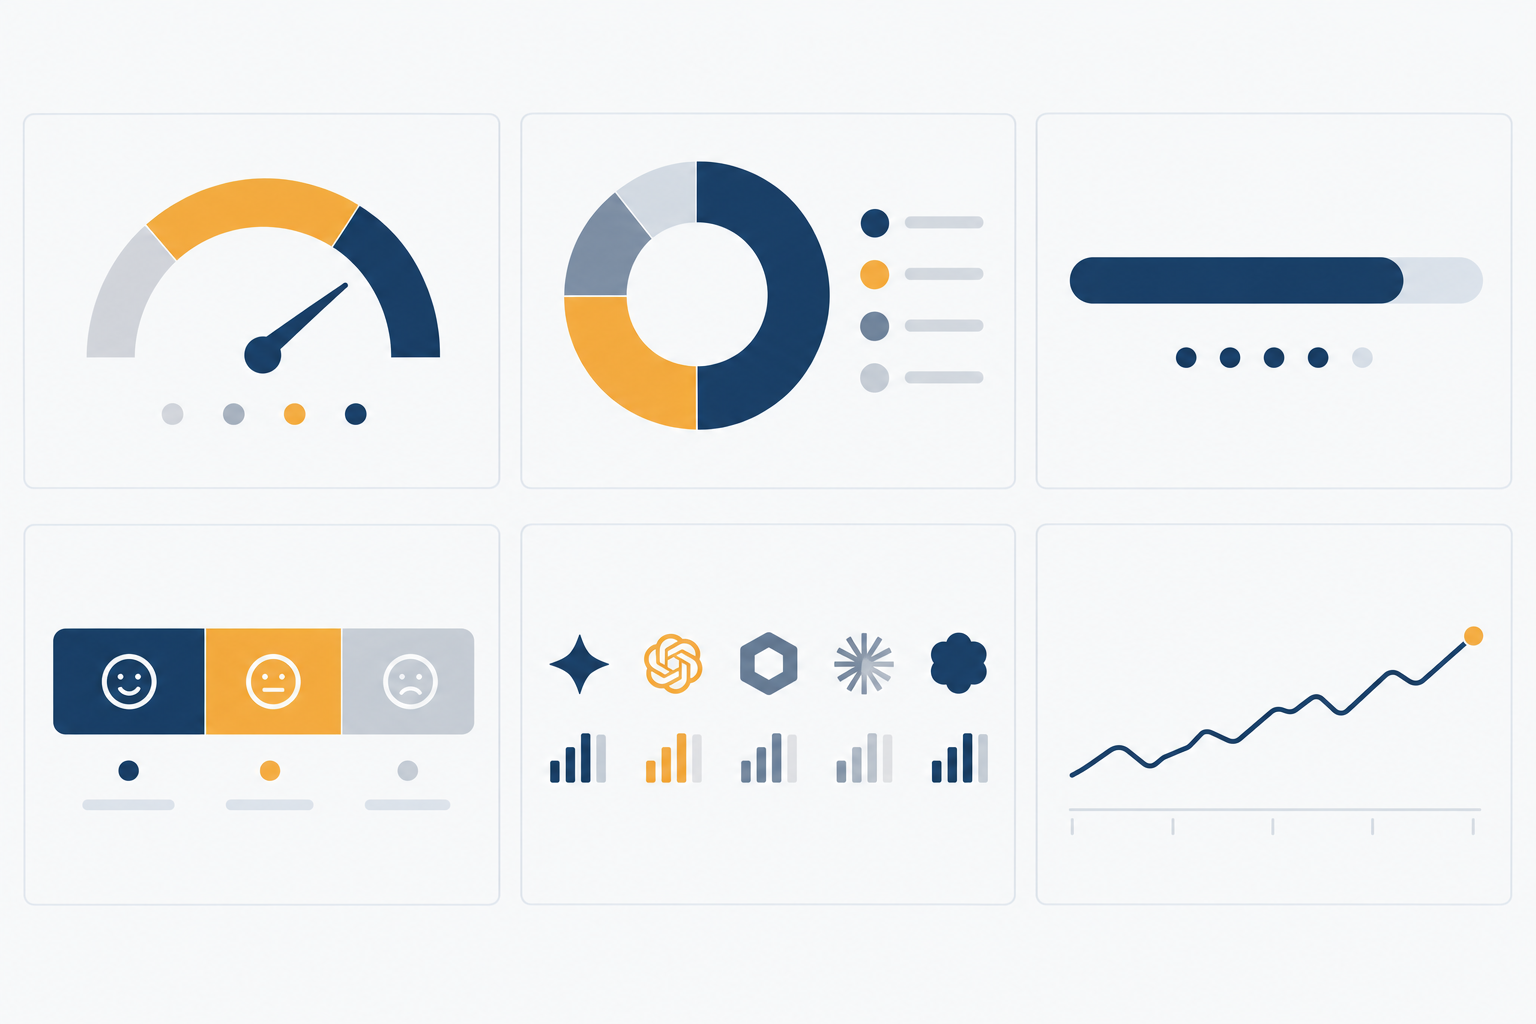
An AI share of voice report is a defined measurement, not a universal industry standard, so every KPI below needs a plain statement of how it is calculated. I split them into six headline KPIs for the main slides and two supporting diagnostics for the actions slide or appendix.
The six headline KPIs:
The two supporting diagnostics:
Several of these measures mean nothing without operational definitions. Put the following on a footnote slide or in the appendix:
| Measure | Definition to document | Main limitation to state |
|---|---|---|
| Visibility score | Weighted blend of query coverage, position-weighted citations, share of voice and unlinked brand mentions; publish the weights | Weights are a judgement call, not an industry standard |
| Share of voice | Your mentions and citations divided by all tracked-brand mentions and citations across the question set | Changes if you add or remove competitors |
| Citation position | Order in which your brand or URL appears in an answer (1 = first); report the average only where you appear | Not every answer is a ranked list |
| Sentiment | Positive, neutral or negative per mention, coded by a documented rubric, with a manual sample check | Automated classification misreads nuance and sarcasm |
| Sample size | Number of questions multiplied by runs per platform; I would want at least 100 to 150 questions before reporting by segment | Thin segments produce noise that looks like insight |
Break results out by market, product category or prompt type only where the sample supports it. 'Soft mentions', in the score above, simply means the brand is named without a link or formal citation. Position-weighted citations give more credit to being cited early than late.
Four practical points for a UK team. First, phrase the tracked questions the way UK buyers would, with UK spelling, 'VAT', 'GDPR' and UK-specific comparisons, and record the locale in your methodology, since answers differ by market. Second, align quarters with your financial year, which for many UK organisations runs April to March, so the QBR lines up with budget cycles. Third, if you rely on cookieless analytics for AI referral traffic, check your consent position under UK GDPR and PECR with your data protection lead rather than assuming the tool resolves it. Fourth, self-reported attribution fields collect personal data context, so keep them within your privacy notice.
Omit vanity metrics, single-day snapshots and any number you cannot explain in one sentence. Resist substituting Google Search Console totals for AI measurement, too. Google's documentation on AI features states that clicks and impressions from these features are included in the overall Web search data with no separate filter. Search Console is useful for search performance, but it is not an AI visibility report.
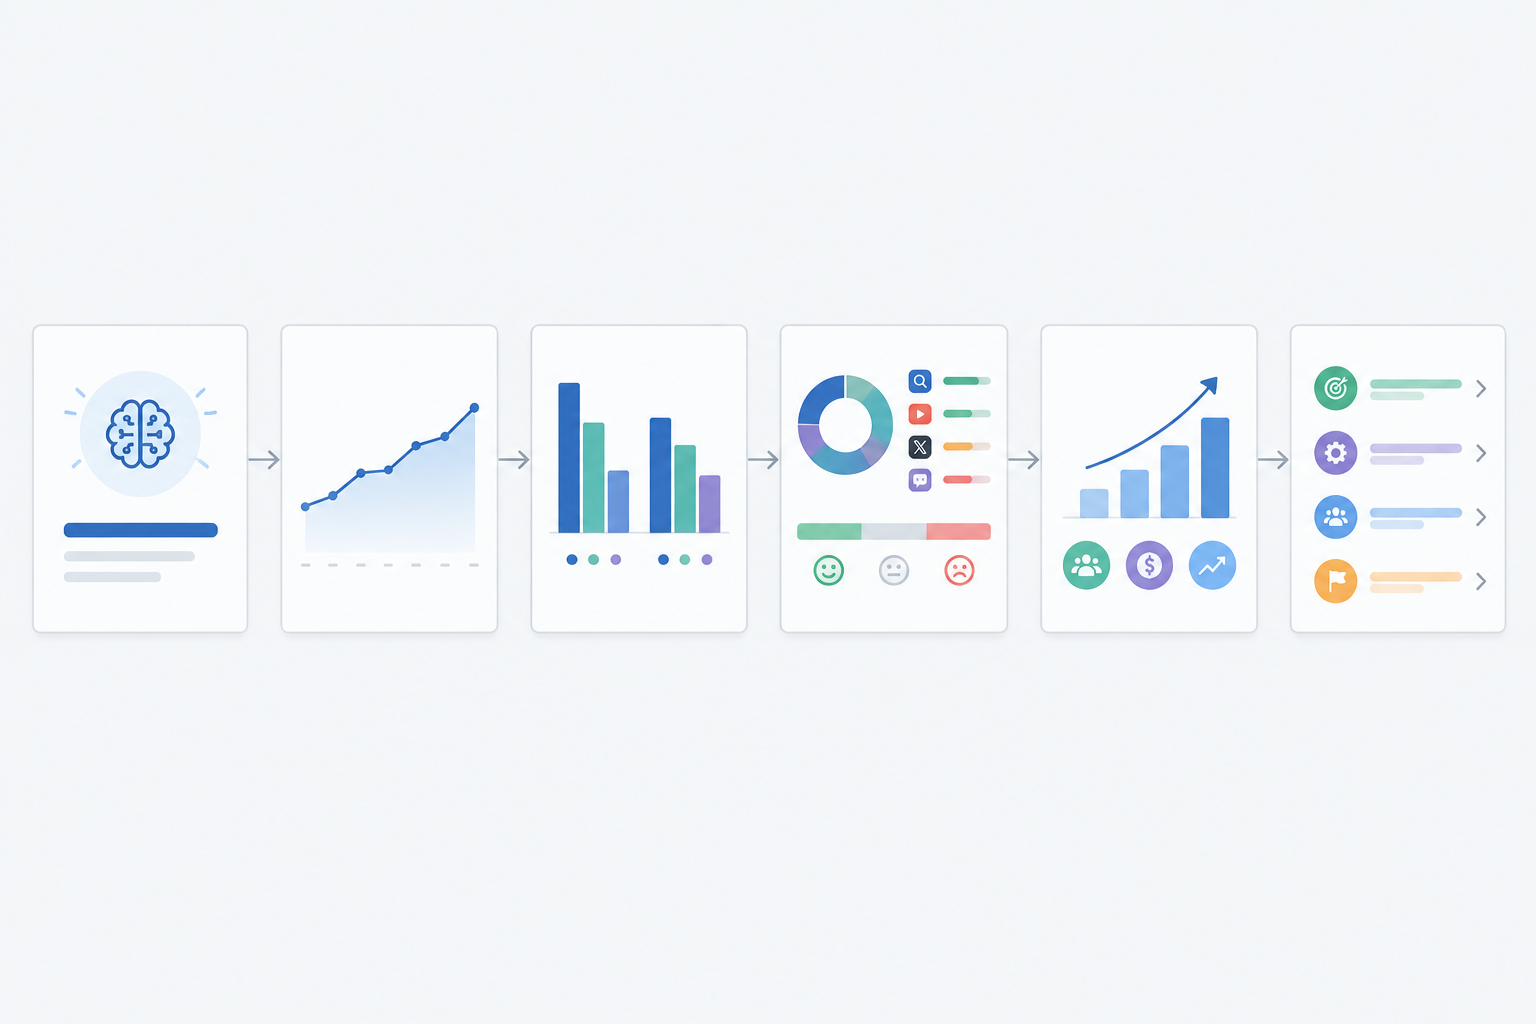
There are two formats here, and they tell the same story at different depths. I would send the three-slide board summary to non-executives. The six-slide QBR is for the leadership meeting itself.
| Board summary (3 slides) | Expanded QBR (6 slides) |
|---|---|
| 1. Headline: score, share of voice, quarter-on-quarter trend | 1. Headline and 2. Trend |
| 2. Competitors and platforms | 3. Competitor comparison and 4. Platform and sentiment detail |
| 3. Cautious pipeline context and next actions | 5. Business connection and 6. Actions and asks |
The expanded sequence runs like this.
Two additions help the deck survive scrutiny. First, include a short 'how we measure' footnote covering the question set, its size, run frequency, platforms, markets and collection dates. Second, keep speaker notes for the awkward questions, especially 'why did the score move when nothing changed on our site?' The honest answer is that models update, retrieval sources shift and competitors publish. That is exactly why you rely on the aggregated trend and not on any single movement.
Suppose the headline slide reads: 'Share of voice on UK buyer questions is 9%, against 31% for our closest rival.' Slide 3 shows that the gap sits almost entirely in comparison-style questions, and the legibility audit shows our pricing and comparison pages fail four crawler checks. The decision slide then asks for 'two weeks of developer time to fix the four failed checks and one new comparison page, with a target of 15% share of voice on those questions by next quarter, reviewed in the October QBR.' Every element, from metric to evidence to ask to review date, can be traced back, and that traceability is what lets executives approve it. (Figures illustrative.)
The charts do most of the persuasive work, so each should carry one message and be readable in under ten seconds.
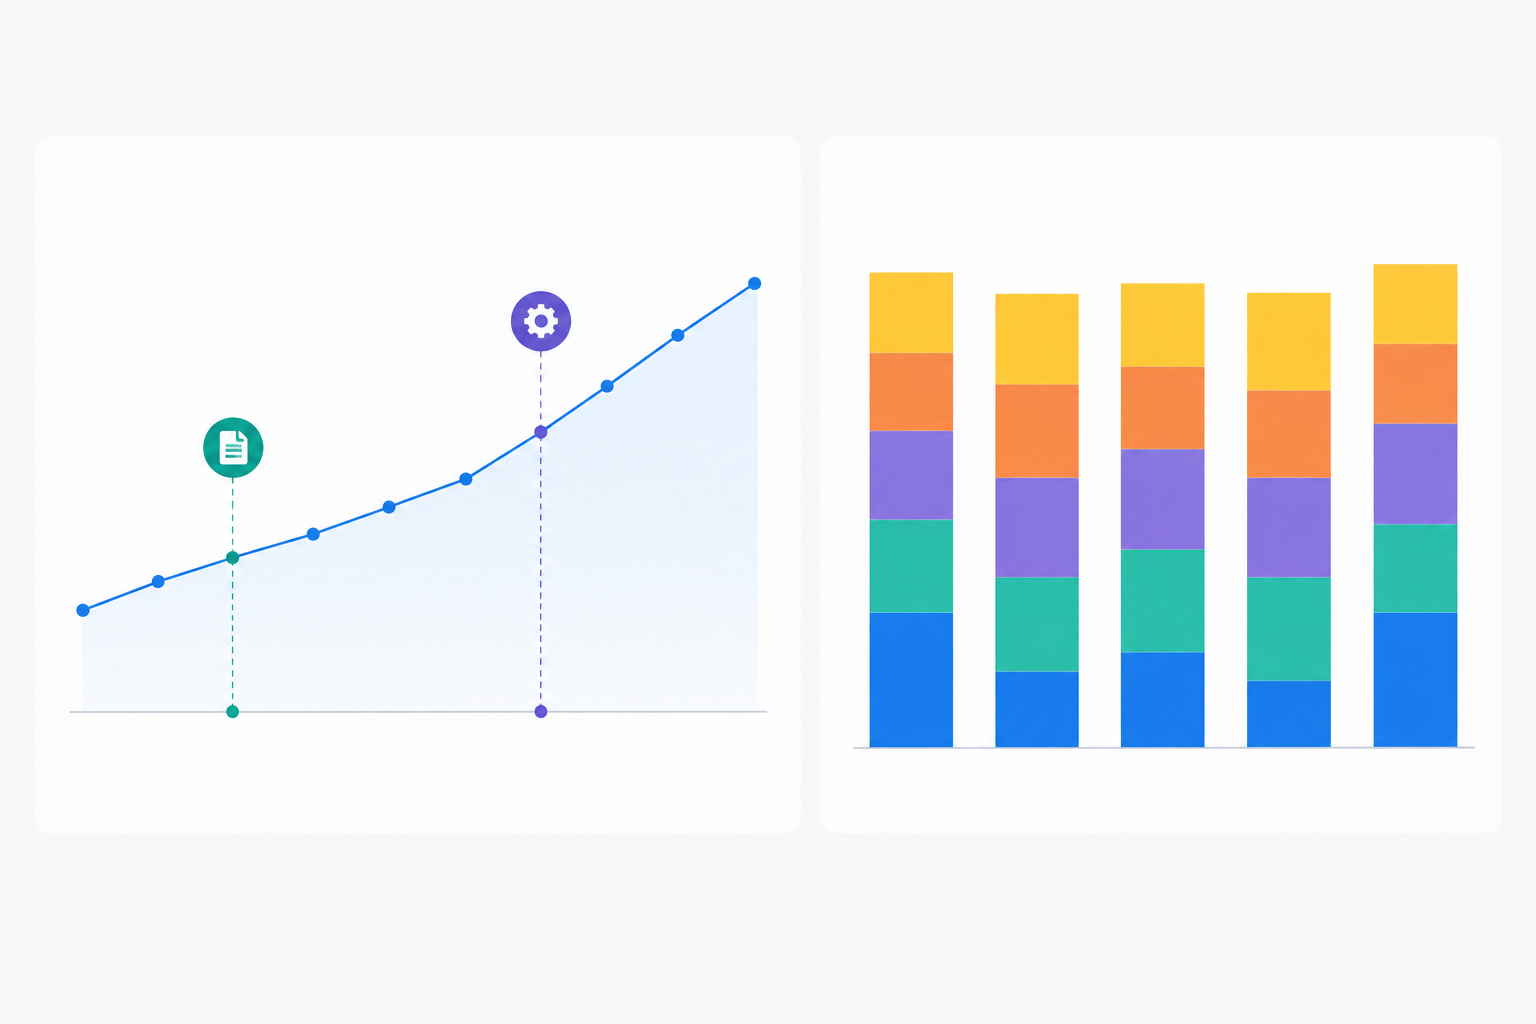
A compact table often communicates more than a chart. Here is the template I use, with illustrative placeholders:
| Metric | Your brand | Competitor A | Competitor B | Competitor C |
|---|---|---|---|---|
| Visibility score (0-100) | 48 | 62 | 41 | 35 |
| AI share of voice | 21% | 33% | 18% | 12% |
| Positive sentiment | 64% | 71% | 58% | 49% |
| Average citation position | 2.8 | 1.9 | 3.4 | 4.1 |
Mark leading and lagging cells with green and red indicators, and state the question set size underneath.
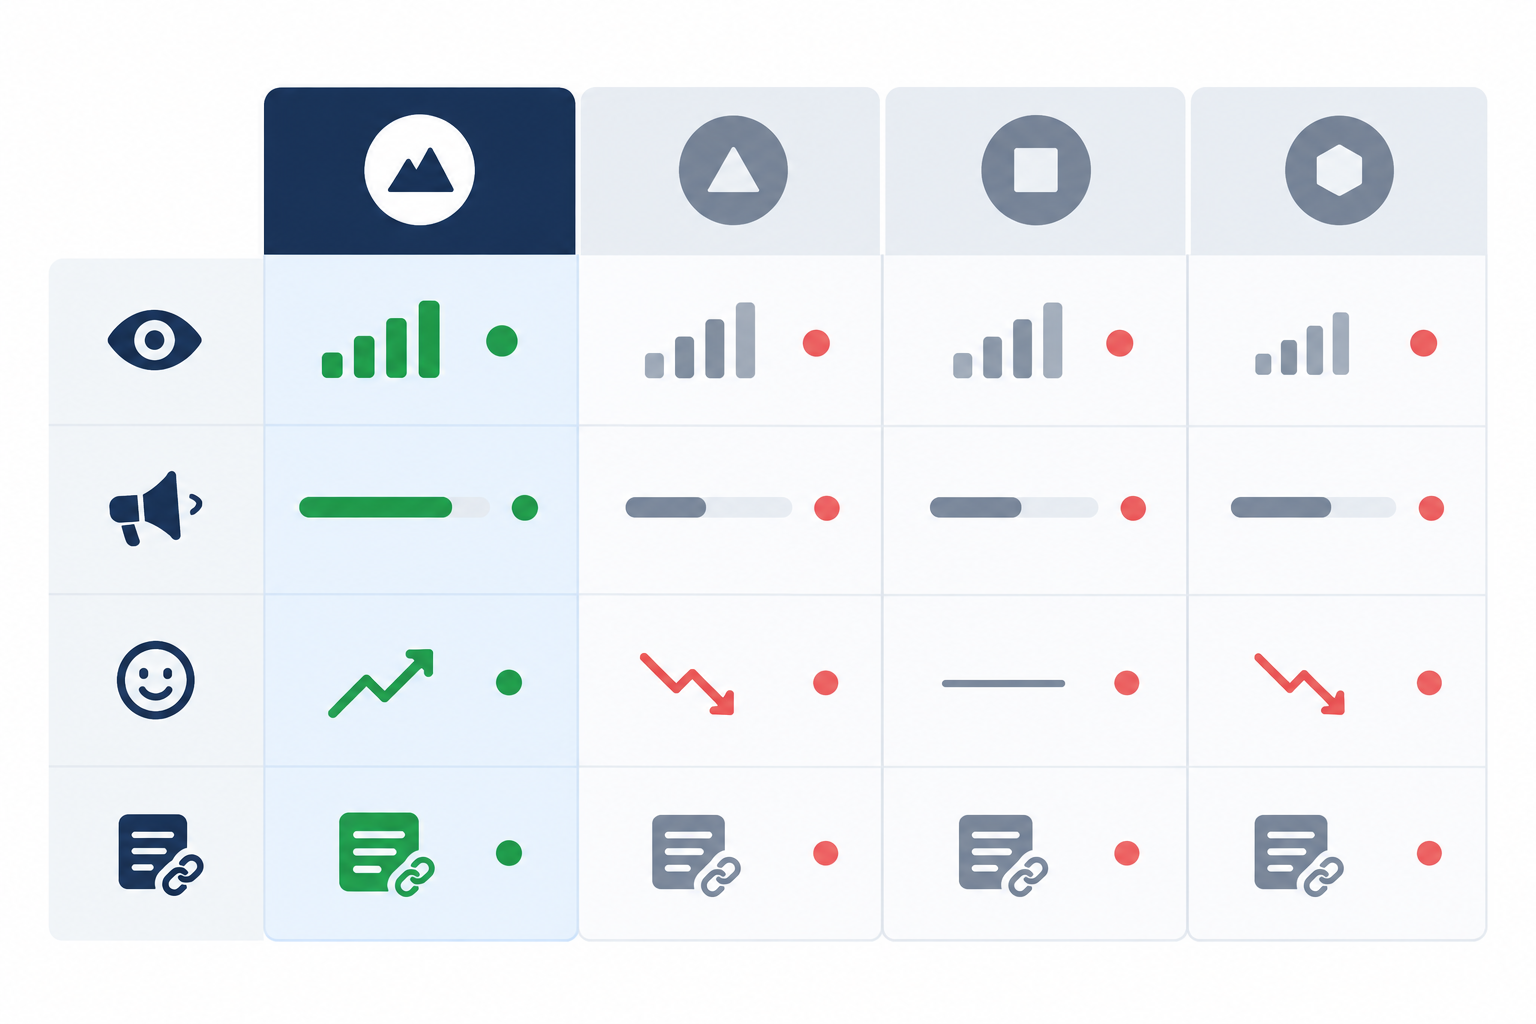
Use one message per chart, the same competitor colours on every slide, a labelled baseline so improvement is measured against something, and no more than five series per chart.
AI answers are probabilistic. Ask the same question twice and you may get different brands in a different order. Repeated runs across many questions give a far more stable signal than any individual answer, which is why LLM monitoring should be continuous rather than ad hoc. A one-off check in the week before the QBR measures luck as much as visibility. Whichever tool you use, keep the prompt panel consistent, because changing the questions mid-quarter breaks comparability.
Leadership will ask about revenue, and this is where credibility is won or lost. Attribution is imperfect. Many AI-influenced buyers arrive via direct or branded search, so last-click analytics will understate impact. Equally, a mention in an AI answer does not prove that a prospect saw it, visited your site or later influenced an opportunity. Treat AI visibility as an upper-funnel signal, not proof of attribution.
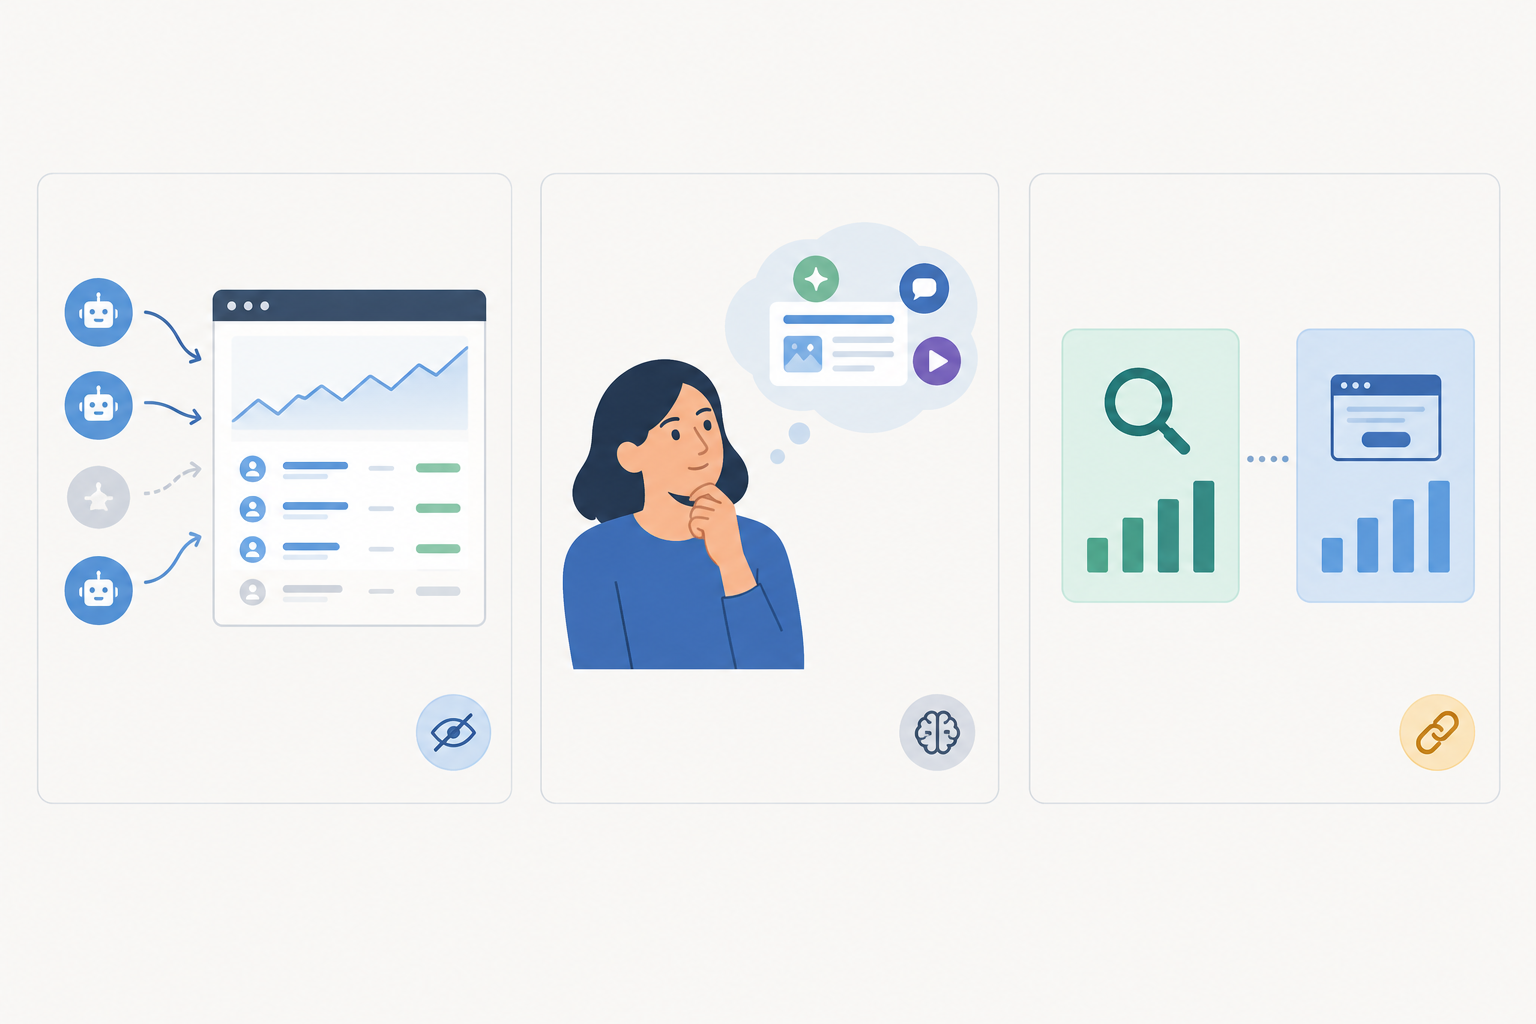
These are different kinds of evidence, not a ladder of increasing proof. Keep 'AI visibility' and 'AI referral traffic' as distinct metrics. Report referral sessions and conversions as observed activity, report opportunities with an AI-related touch as influenced or associated, and reserve causal language for analyses with a credible comparison design.
The figures below are hypothetical, to show the format:
The appropriate wording is: 'The increase in AI share of voice is consistent with the rise in branded search and self-reported AI-sourced demos. It suggests a relationship but does not establish one, as we also ran a PR campaign this quarter.' Put the caveats on the slide itself, not only in the notes.
Ask your sales team to record whether prospects consulted an AI assistant during evaluation, and which one. It costs almost nothing, and verbatim answers often persuade executives more than any dashboard does. Do not present a pound-sterling return on AI visibility until you have at least two quarters of consistent data. A premature figure invites challenge and damages the credibility of the rest of the deck.
Different audiences need different rhythms.
A quarterly view smooths volatility, while monthly checkpoints prevent surprises. If a competitor displaced you on a key question in week three, the QBR should not be where anyone first hears about it. I would also feed your BI tool from an API or scheduled export, so the figure in the board deck matches the one the team saw in the weekly digest, with no manual transcription.
The final slide should turn data into decisions. This is the sequence I suggest, roughly from fastest to slowest to deliver.
Lead with an overall visibility score, AI share of voice against named competitors, and sentiment. Use query coverage and platform breakdown for context, and keep technical measures in the appendix or actions slide.
Describe it as share of voice for the AI era, using the one-sentence definition above, then show a single competitor comparison. Rankings against rivals need no explanation.
Collect daily, review weekly, discuss monthly and present quarterly to leadership. Aggregated trends are far more reliable than individual snapshots.
Not conclusively. Present directional evidence from referral traffic, self-reported attribution and correlation, and state the limits plainly.
Three to five. Fewer offers little context, and more clutters the chart. Choose rivals leadership already recognises, plus one emerging challenger if the data shows one.
The work behind a credible QBR is unglamorous: a fixed question set, consistent collection, clearly defined metrics and honest caveats. Whatever tooling you choose, start collecting now. The two quarters of consistent data that make a trend persuasive can only be gathered over time. 🦉
Disclosure: I work on MentionOwl, an AI visibility tracking product. The guidance above is tool-agnostic and can be followed with any consistent method, including a manual question panel in a spreadsheet.