LinkedIn Ads Benchmarking: What B2B Competitors Are Actually Testing Right Now
LinkedIn Ads Benchmarking: What B2B Competitors Are Testing Right Now
If you search for “LinkedIn ads best practices”, you’ll find the same generic advice everywhere: use video, keep copy short and test your calls to action. None of that is wrong, exactly. It’s just not specific enough when you’re trying to understand what’s happening in your niche, against your exact buyers, right now.
That’s what LinkedIn ads benchmarking should really mean—not a list of theoretical tips, but a view of what competitors in your space are visibly testing, how long they’re running it and what they quietly stop. Here’s the upfront, honest answer: across the UK and international B2B accounts we track at Rival Ads, we’re seeing more founder-led and employee-generated content, more short-form video and carousel testing relative to static images, and creative refresh cycles that tend to land somewhere in the two-to-four-week range for top-of-funnel ads.
Those are patterns of activity, not proof of what’s converting best. I’ll explain that distinction properly below, because it matters more than most benchmarking content admits.
This post is our attempt at a genuine benchmark of B2B competitor ads, built from what we can observe in public ad activity plus LinkedIn’s own published guidance, rather than another list of generic recommendations. Let’s get into it.
LinkedIn Ads Benchmarking Methodology: What This Benchmark Can and Can’t Tell You
Before the findings, it’s worth being upfront about where this data comes from and what it can and can’t show you.
The patterns in this post are drawn from ongoing monitoring of LinkedIn ad activity across several hundred B2B accounts in our tracking system, spanning SaaS, professional services, fintech and industrial/manufacturing sectors. The sample includes UK and wider European advertisers alongside US accounts, observed over the past several months.
“Active” means an ad is currently visible in LinkedIn’s ad activity; “stopped” means it’s no longer showing after previously appearing consistently. That’s the extent of what public monitoring reveals.
Here’s the honest limitation: none of this tells us click-through rates, cost per lead, conversion rates or return on ad spend. A competitor running an ad for eight weeks might be scaling a winner, or might simply have a large enough budget and audience that it hasn’t reached frequency fatigue yet.
An ad disappearing might mean it underperformed, but it could also mean the campaign budget ran out, the offer expired or the creative was moved into a different campaign structure. We flag these caveats throughout rather than pretending public data shows more than it does.
So treat everything below as a working hypothesis worth testing against your own data—not an industry-verified benchmark.
Why LinkedIn Ads Benchmarking Is Different From Other Platforms
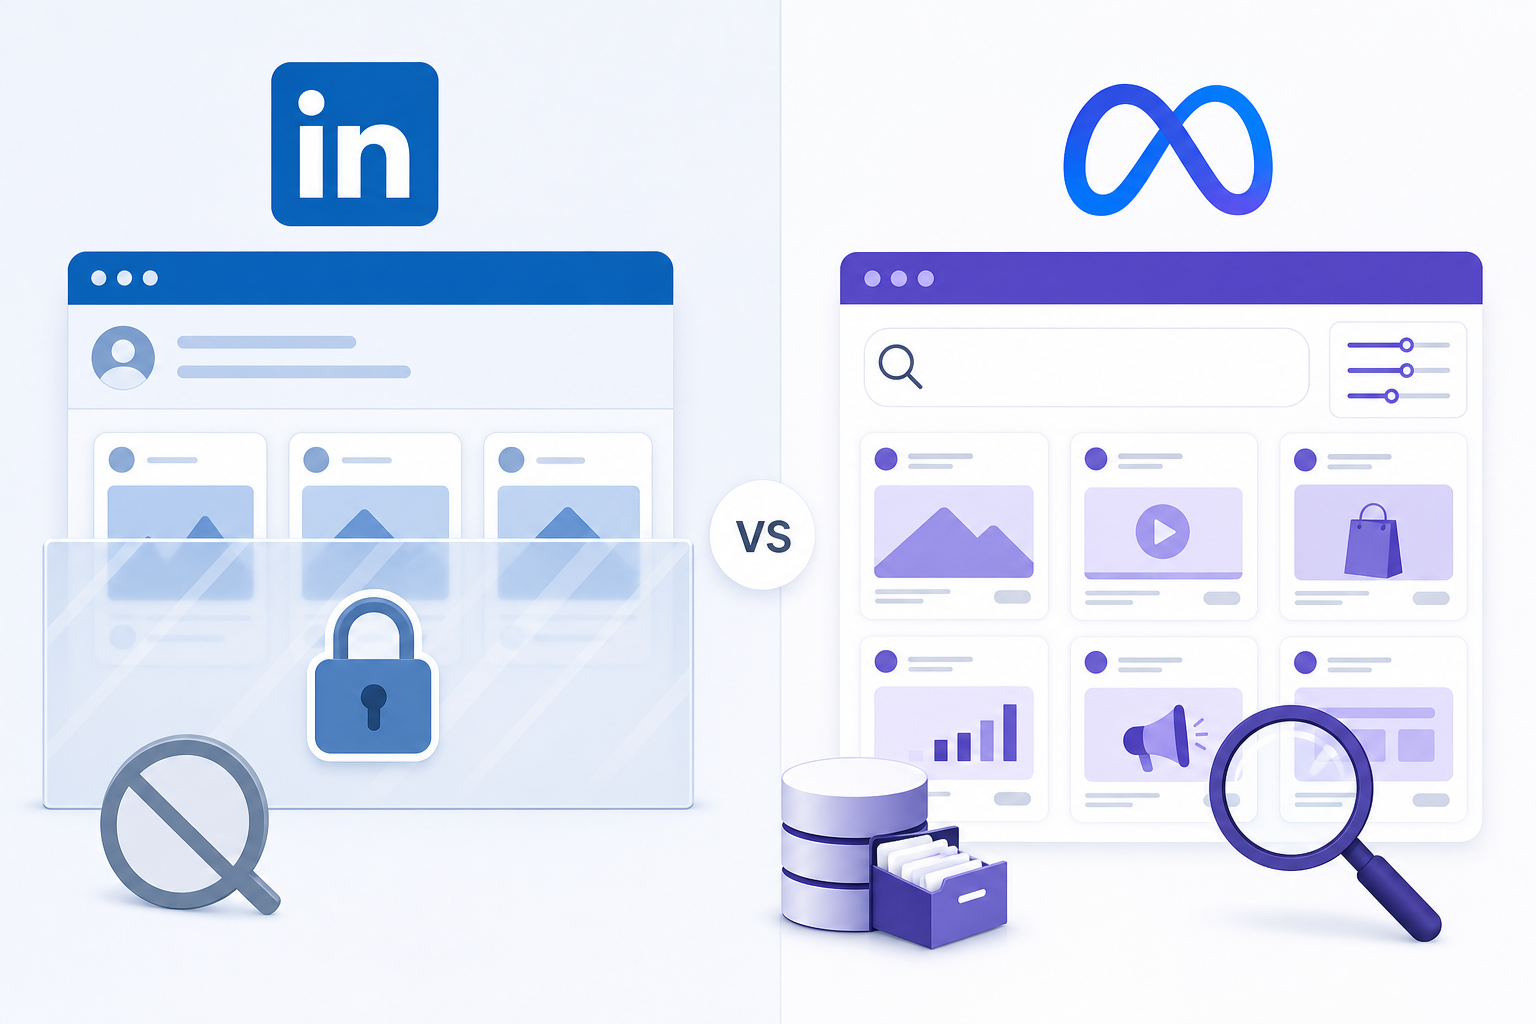
If you’ve tried to benchmark LinkedIn advertising in the same way you would benchmark Meta, you’ll have hit a wall pretty quickly. LinkedIn’s transparency tools are more limited, and the platform’s logic is genuinely different, which changes how you should interpret the activity you see.
A few factors make LinkedIn distinct as a competitive intelligence environment:
- Less public data to work with. Meta’s Ad Library shows spend ranges, reach and how long an ad has run. LinkedIn’s Ad Library, by comparison, is a directional creative and messaging database at best—it doesn’t reveal spend, targeting or performance, and it doesn’t guarantee a complete historical record. Treat it as evidence of testing activity, not proof that an ad is winning.
- Higher CPCs may encourage more deliberate iteration. B2B advertisers on LinkedIn typically pay a premium for professional targeting, which is a plausible reason they appear to test fewer variants more carefully rather than running dozens of quick variations. We can’t verify this from public data alone, but it’s consistent with what we observe.
- Audience context is different. LinkedIn users are generally in a professional mindset when scrolling, evaluating credibility and relevance rather than looking primarily to be entertained. Messaging that works well on Meta doesn’t always translate directly.
- Long B2B sales cycles change what “performance” likely means. A single LinkedIn ad rarely drives an immediate sale. LinkedIn’s B2B Institute has referenced research suggesting that a large majority of B2B buyers are out of market at any given time (LinkedIn B2B Institute, “The 5% Rule”, 2021). This may help explain why so much competitor creative looks like brand-building and category education rather than hard-sell offers.
One more wrinkle is worth flagging for UK marketers specifically: buying committees here often include a mix of finance, IT/security and end-user stakeholders. UK B2B buyers also tend to respond well to understated, evidence-led messaging over aggressive sales language.
A single company might run different messaging to a CFO, a security lead and a practitioner for the same product. Comparing a blended “competitor ad performance” figure without separating these audiences can mislead you. The most useful LinkedIn ads benchmarking splits activity by role, funnel stage and format—not just by brand.
Messaging Trends in B2B Competitor Ads on LinkedIn
Across the accounts we monitor, a handful of messaging patterns keep appearing. To be clear, these are patterns in what’s being tested and kept running, not confirmed performance winners. Here’s what that looks like in practice, with anonymised examples from ads we’ve tracked.
- Founder-led and “talking head” messaging is appearing more often than generic brand-voice copy. One UK-based project management SaaS company we track replaced a polished brand video with a 45-second, selfie-style clip of its VP of Sales talking through a common objection—and kept it running for over six weeks, longer than its typical creative lifespan. LinkedIn’s Thought Leader Ads product, which lets brands sponsor posts from employees or executives, exists partly because this format has traction. A widely cited Edelman-LinkedIn B2B Thought Leadership Impact study has reported that a majority of decision-makers view thought leadership as a meaningful trust signal, although exact figures vary by year and methodology. Check the current report rather than treating any single percentage as fixed.
- Pain-point-first hooks appear more frequently than feature-first headlines. Instead of “Introducing our new analytics suite”, competitors are opening with “Still exporting reports into spreadsheets every Monday?” This signals relevance immediately to LinkedIn users who are scanning quickly.
- Social proof is becoming more specific. Vague testimonials are being replaced by named customers and concrete numbers. One HR tech competitor we track ran an ad citing “cut onboarding time by 40% at [named UK retailer]” for nearly two months, well beyond its usual rotation. Specificity likely helps a buyer build an internal business case, although we can’t confirm whether this drove the extended run versus budget or audience size.
- Contrarian and myth-busting angles show up regularly. Headlines such as “Your CRM data is lying to you” stand out in a feed otherwise full of safe, corporate-sounding copy.
- Copy is getting shorter, with more line breaks. Dense, paragraph-style ad text is losing ground to short lines with breathing room, making it easier to scan on mobile.
We’ve also noticed competitors increasingly building a message matrix rather than relying on a single ad concept: the same value proposition reworded for finance, IT and the C-suite. If you’re only tracking one ad per competitor, you’re probably missing this entirely.
How to track these messaging trends yourself: for each competitor, log the ad’s first-seen date, last-seen date, format, message angle, CTA and landing page. Compare that log week over week rather than relying on memory. Patterns only become visible over time, and a single snapshot tells you very little.
LinkedIn Ad Formats Gaining Traction in B2B Campaigns
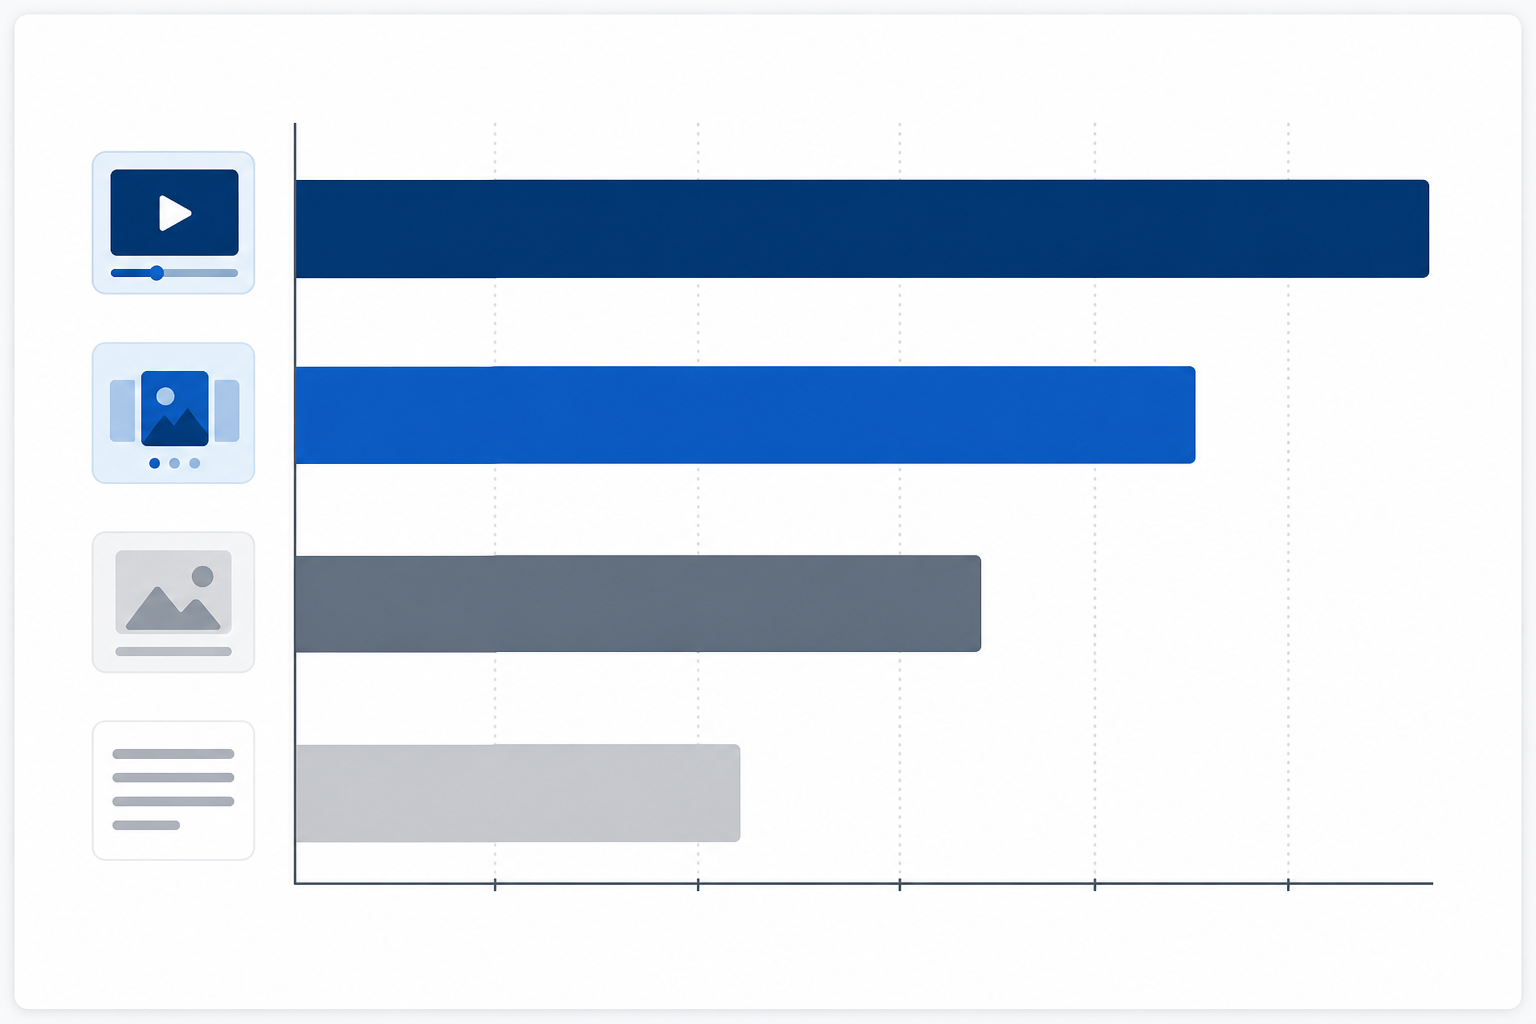
Format testing on LinkedIn has diversified over the past couple of years. It’s no longer just static images and the occasional video. However, a word of caution before the table: what follows describes what’s being tested and kept live, not confirmed performance winners. A competitor’s visible ad rotation reflects budget, audience size and bidding strategy as much as it reflects results.
| Format | Observed use | Likely job to do | What to validate before assuming it works for you |
|---|---|---|---|
| Short-form video (30–60 seconds) | Appearing more often than static images in the accounts we track, especially with captions and an early hook | Product demos, executive takes and customer proof | Watch completion rates and CTR in your own account before shifting budget |
| Document ads / carousels | Increasing for gated reports, frameworks and thought-leadership pieces | Mid-funnel education and research offers | Test gated versus ungated versions of the same content |
| Employee-generated / UGC-style video | Gaining visible ground against produced brand video | Building trust and humanising the brand | Check whether engagement translates to lead quality, not just views |
| Single-image ads | Still common, particularly for retargeting and direct offers | Bottom-funnel activity and warm-audience conversion | Compare against video retargeting to see if the gap holds for your audience |
| Text-only / minimal-design ads | A deliberate choice to feel native and less like an obvious ad | Scroll-stopping in feeds full of polished creative | Test alongside a designed variant—native isn’t always better |
Document ads let a competitor preview a report or guide directly in the feed, either gated or open. This makes them useful for testing different levels of conversion friction on the same content.
Carousel and document formats also suit B2B’s more complex buying journeys. They can sequence a problem, a proof point and a call to action across multiple cards rather than cramming everything into one image.
Again, format popularity in what you observe is a signal of what’s being tested at scale, not a guaranteed performance ranking. Treat it as a shortlist of ideas worth testing with your own A/B testing budget, not a verdict.
How Often Do B2B Competitors Refresh Their LinkedIn Ad Creative?
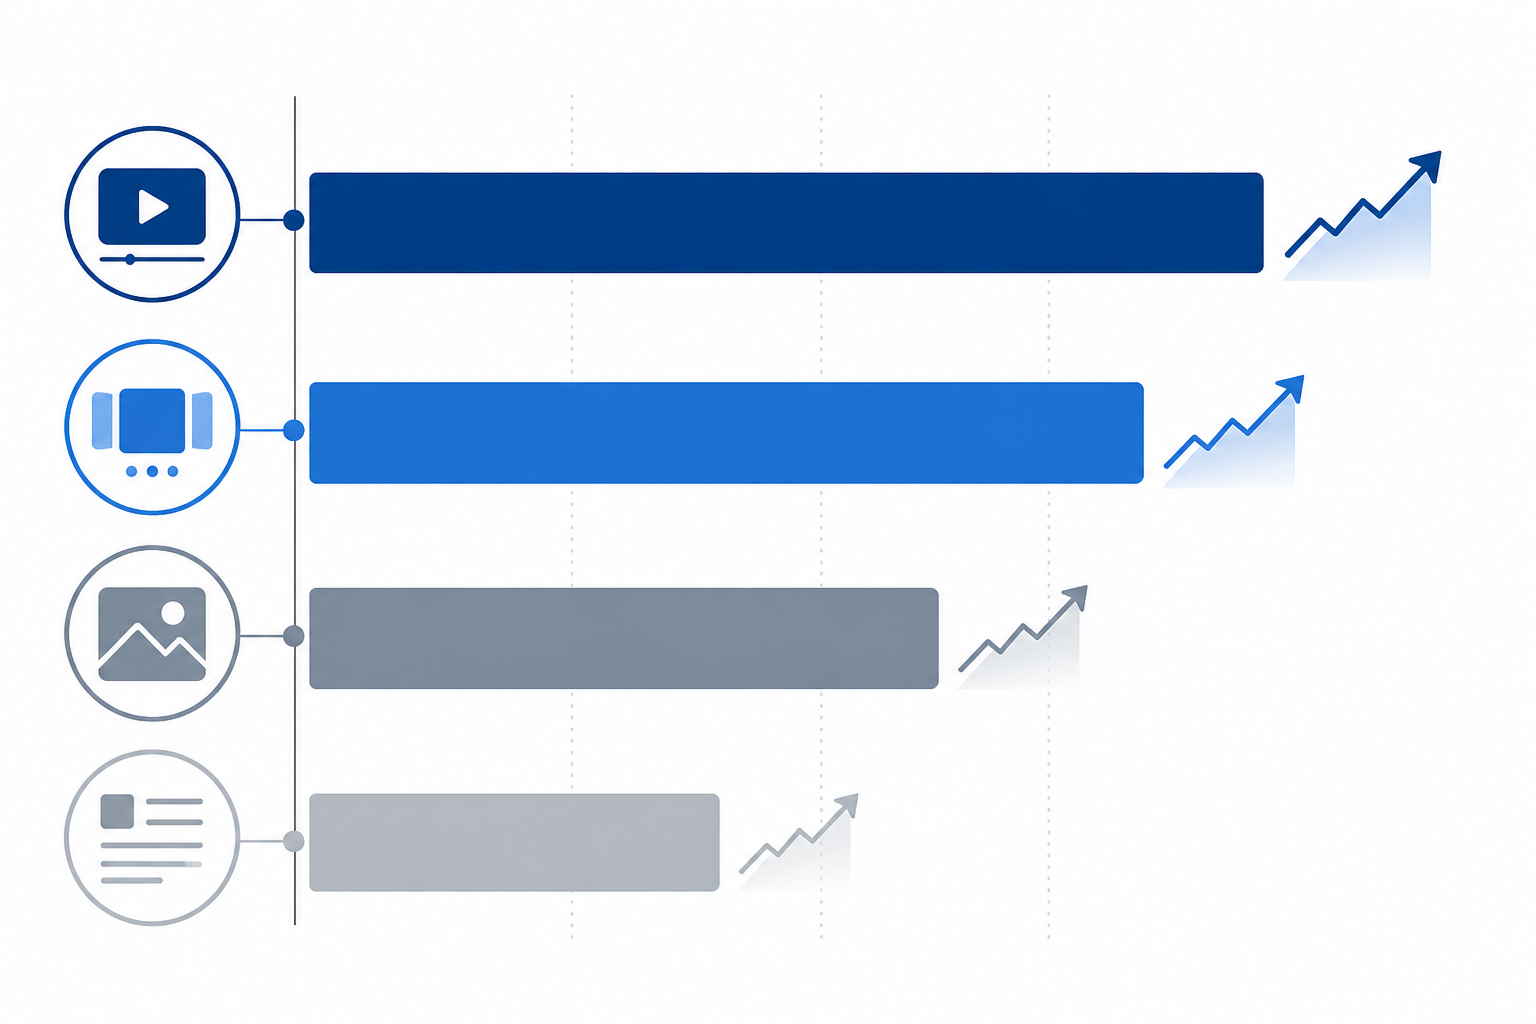
This is one of the most useful things to track and one of the least discussed, partly because there’s no official, published industry benchmark for LinkedIn creative refresh rates. LinkedIn doesn’t publish an average, and its Ad Library doesn’t track duration precisely.
The ranges below come from our own tracked sample, not an established industry standard. Treat them as a starting hypothesis to test against your own competitive set.
From what we consistently see across the accounts we monitor:
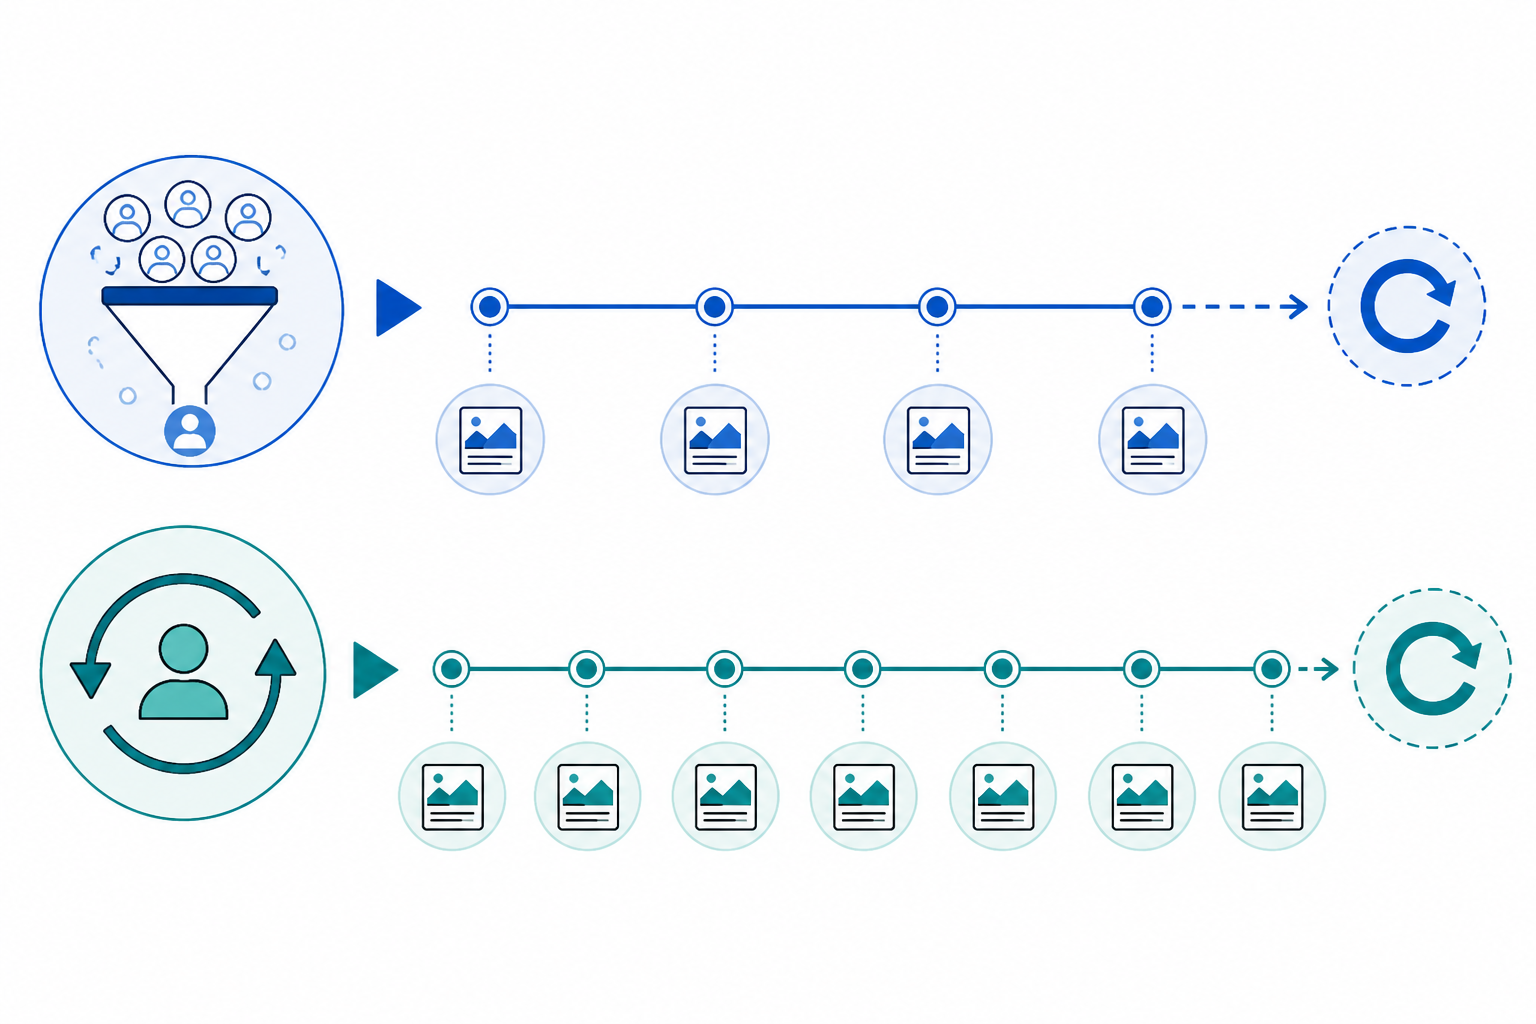
- Top-of-funnel awareness ads tend to be refreshed roughly every 2–4 weeks in our sample. This is broadly consistent with LinkedIn’s own creative guidance, which suggests reviewing ad performance regularly to manage frequency and fatigue (see LinkedIn Marketing Solutions’ ad optimisation guidance).
- Retargeting and direct-offer ads typically appear to run longer in our tracking—often 6–8 weeks—before rotation. This may be because these audiences are smaller and take longer to reach frequency thresholds.
- Competitors testing new angles often run several variants in parallel, rather than one after another. If you only check in occasionally, you might see three different ads and assume rapid turnover, when they’ve actually been running side by side as an A/B test.
- A sudden stop on a previously steady ad is worth investigating, but it isn’t automatically a sign of poor performance. When an ad that has run steadily for weeks disappears, it might mean performance dropped and the team pulled it. It might also mean the budget or campaign ended, the offer expired or it moved into a different campaign structure that you can no longer see. Public monitoring can’t distinguish between these possibilities, so treat a stopped ad as a prompt to investigate rather than a confirmed signal.
This kind of pattern is easy to miss with manual, occasional checks. It’s part of why we built week-over-week diffs into Rival Ads: instead of trying to remember what a competitor’s ad looked like last month, you get a “what’s new, what’s stopped, what’s scaling” view every week, with an AI-generated read on what it might mean. That read is flagged as a hypothesis for you to verify, not a definitive answer.
Thought-Leadership Ads vs Direct-Offer Ads: What to Look For
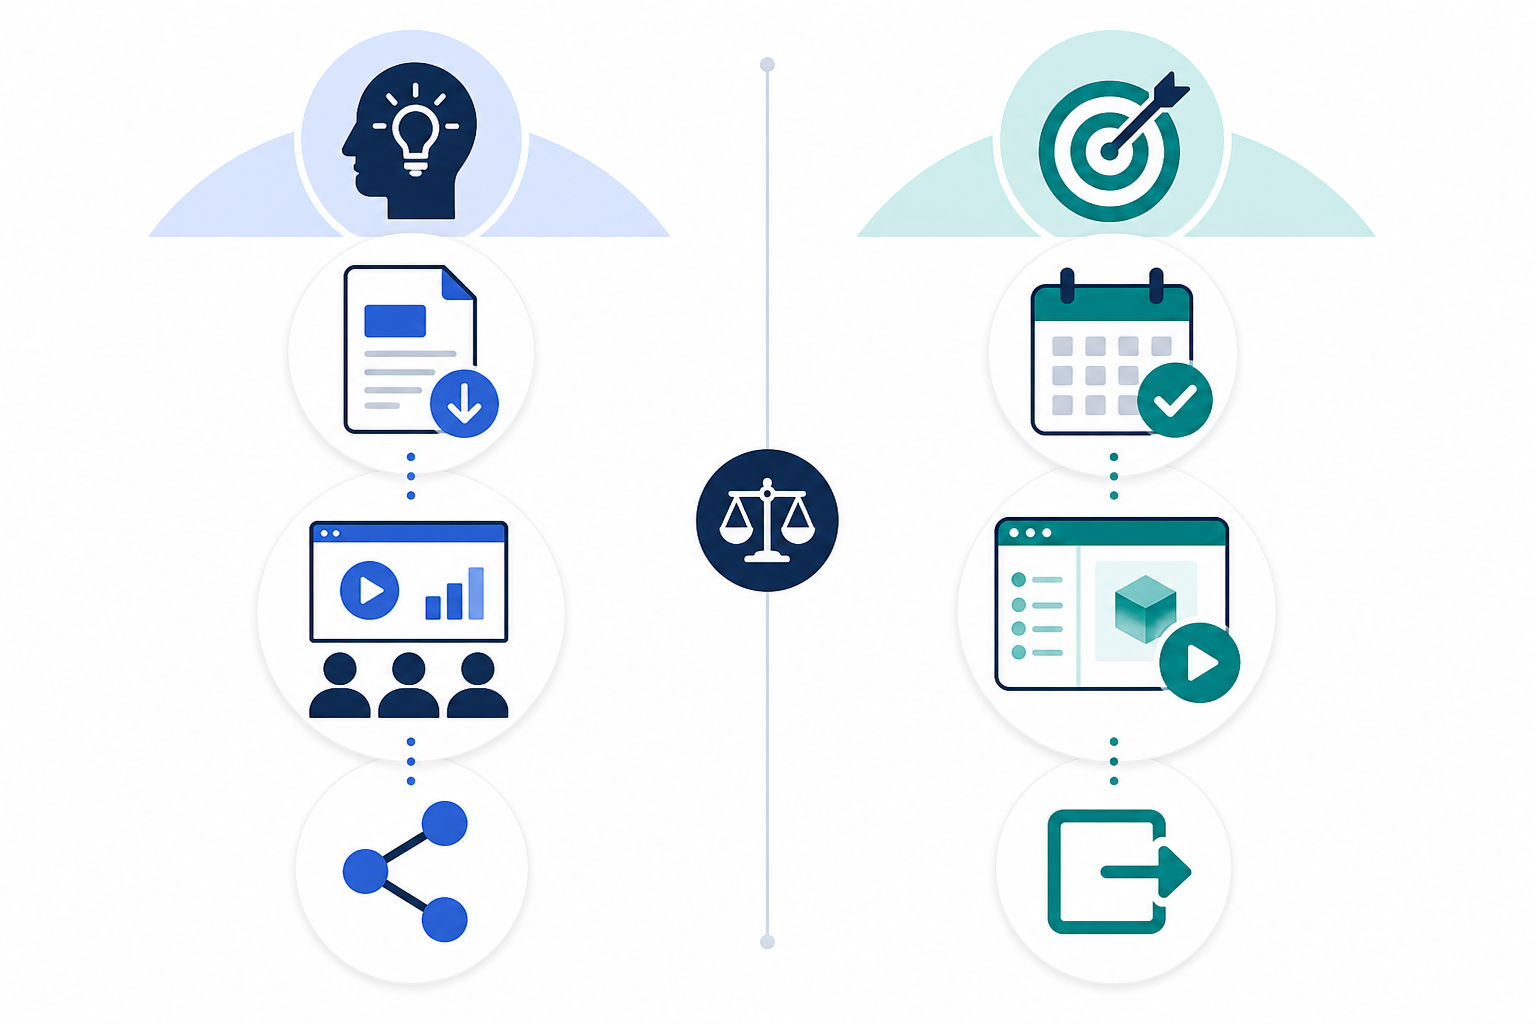
Not every competitor ad is trying to do the same job, and lumping all B2B competitor ads together is a common benchmarking mistake. Splitting them into two broad, common patterns—rather than fixed rules—makes the picture clearer.
| Thought-leadership ads (common pattern) | Direct-offer ads (common pattern) | |
|---|---|---|
| Typical offer | Gated reports, webinars, benchmark data and research | Demo requests, free trials and discounts |
| Common funnel stage | Often top-of-funnel, although webinars and reports can also retarget warm audiences | Often bottom-funnel, although some brands use demos earlier to qualify interest |
| Likely goal | Category education and trust-building | Conversion and sales-ready leads |
| Typical format | Document ads, carousels and thought-leader posts | Single-image ads and lead-gen forms |
These are common patterns, not universal funnel rules. Plenty of competitors use webinars for retargeting or demos as a top-of-funnel qualifier, so don’t assume that format dictates funnel stage automatically.
How do you tell which type of ad a competitor is prioritising without insider access? Track landing page links and CTA changes week over week. If you keep seeing new links to reports, webinars or research hubs, they’re likely investing in top-of-funnel education. If CTAs keep pointing to “Book a demo” or “Start your free trial”, they’re likely pushing for conversion.
If you’re running lead-gen forms yourself in the UK, remember that consent language and data handling need to meet UK GDPR requirements. It’s worth checking how competitors phrase their forms, since this is a visible signal of how seriously they take data privacy and compliance.
Most mature B2B competitors run both types simultaneously, covering buyers who aren’t ready to talk to sales as well as buyers who are. Seeing only one type in your tracking usually means you’re missing part of their strategy, not that they’ve abandoned the other approach.
How to Apply These LinkedIn Ads Benchmarks to Your Campaigns
All of this is only useful if you turn it into something actionable. Here’s a practical way to apply LinkedIn ads benchmarking, including a simple tracking structure you can build in a spreadsheet today.
Set up a basic tracking log with these columns: competitor name, ad first-seen date, last-seen date, format, message angle, CTA, landing page URL, target audience (your best guess) and status (active / stopped / unclear). Update it weekly. This is the raw material that turns “I think competitors are doing X” into an actual pattern you can analyse.
- Identify three to five direct competitors and track their LinkedIn presence weekly, rather than treating competitor research as a one-off exercise. A single snapshot tells you very little; patterns only emerge over time.
- Look for what’s continuing to run versus what has stopped, but investigate before concluding why. Cross-reference anything public you can find, such as company news, funding rounds and seasonal campaigns, before assuming a stopped ad failed.
- Use messaging and format trends as hypotheses, not templates. If competitors are leaning into founder-led video, that’s worth testing, but your audience, product and proof points are different. Adapt rather than copy, then validate against your own CTR and lead-quality data.
- Set your own creative refresh cadence based on what your specific niche is doing, rather than following a fixed rule. A crowded, high-CPC category might demand faster rotation than a niche vertical with fewer advertisers.
- Validate every pattern against your own internal data before acting on it. Public ad activity tells you what’s being tested; your CTR, cost per lead and pipeline data tell you what’s actually working for your audience.
Most marketing teams don’t have time to check LinkedIn’s ad activity for five competitors every week, log each ad by format and message, and spot the ones that quietly stopped running. That’s the manual research problem tools like Rival Ads are built for: you provide a competitor’s website, and the platform handles weekly detection and archiving across LinkedIn and other major platforms.
As with any public competitive intelligence tool, the activity data should be treated as something to investigate—not as a performance guarantee.
Frequently Asked Questions About LinkedIn Ads Benchmarking
What messaging is working for B2B competitors on LinkedIn right now?
Based on what we’re seeing across the accounts we monitor, pain-point-first hooks, founder-led voices and specific social proof—such as named customers and real numbers—are appearing more often and running longer than generic brand messaging.
That’s a pattern of sustained testing, not confirmed proof of higher conversion rates. We can’t see competitors’ CTR or lead data, only what stays visible. Test these approaches in your own account before assuming they’ll work the same way for your audience.
How often should B2B ads be refreshed on LinkedIn?
In the accounts we track, top-of-funnel creative tends to be refreshed roughly every 2–4 weeks, while retargeting and direct-offer ads often run longer—6–8 weeks—before rotation.
There’s no official LinkedIn benchmark for this, so treat these as working hypotheses from our sample rather than fixed industry rules. Your own frequency and fatigue data will tell you more than any general range.
What creative formats are gaining traction on LinkedIn for B2B?
Short-form video and document or carousel ads are appearing more frequently in the accounts we monitor, particularly for thought-leadership content and gated offers. Static image ads haven’t disappeared—they’re still common for retargeting—but the mix is shifting towards more native, less polished formats such as employee-generated video.
This reflects what’s being tested at scale, not a confirmed performance hierarchy. Use these formats as a shortlist for your own tests, then evaluate CTR, lead quality and pipeline impact.
Can I benchmark LinkedIn ads without connecting my ad account or my competitors’ accounts?
Yes. Tools such as Rival Ads only need a competitor’s website to detect its LinkedIn presence and track active ads weekly, with no ad account access required from either side.
This lets you benchmark messaging, formats and creative refresh patterns from public-facing ad activity. However, it’s important to remember that this shows what’s being tested and kept running—not spend, targeting or performance results, which remain private to the advertiser.
Related Articles
Create content like this automatically
Scribe uses AI to generate high-quality blog posts that engage your audience and drive traffic.