Understanding Your AI Visibility Score: A Metric-by-Metric Guide
17 min read
Loading...

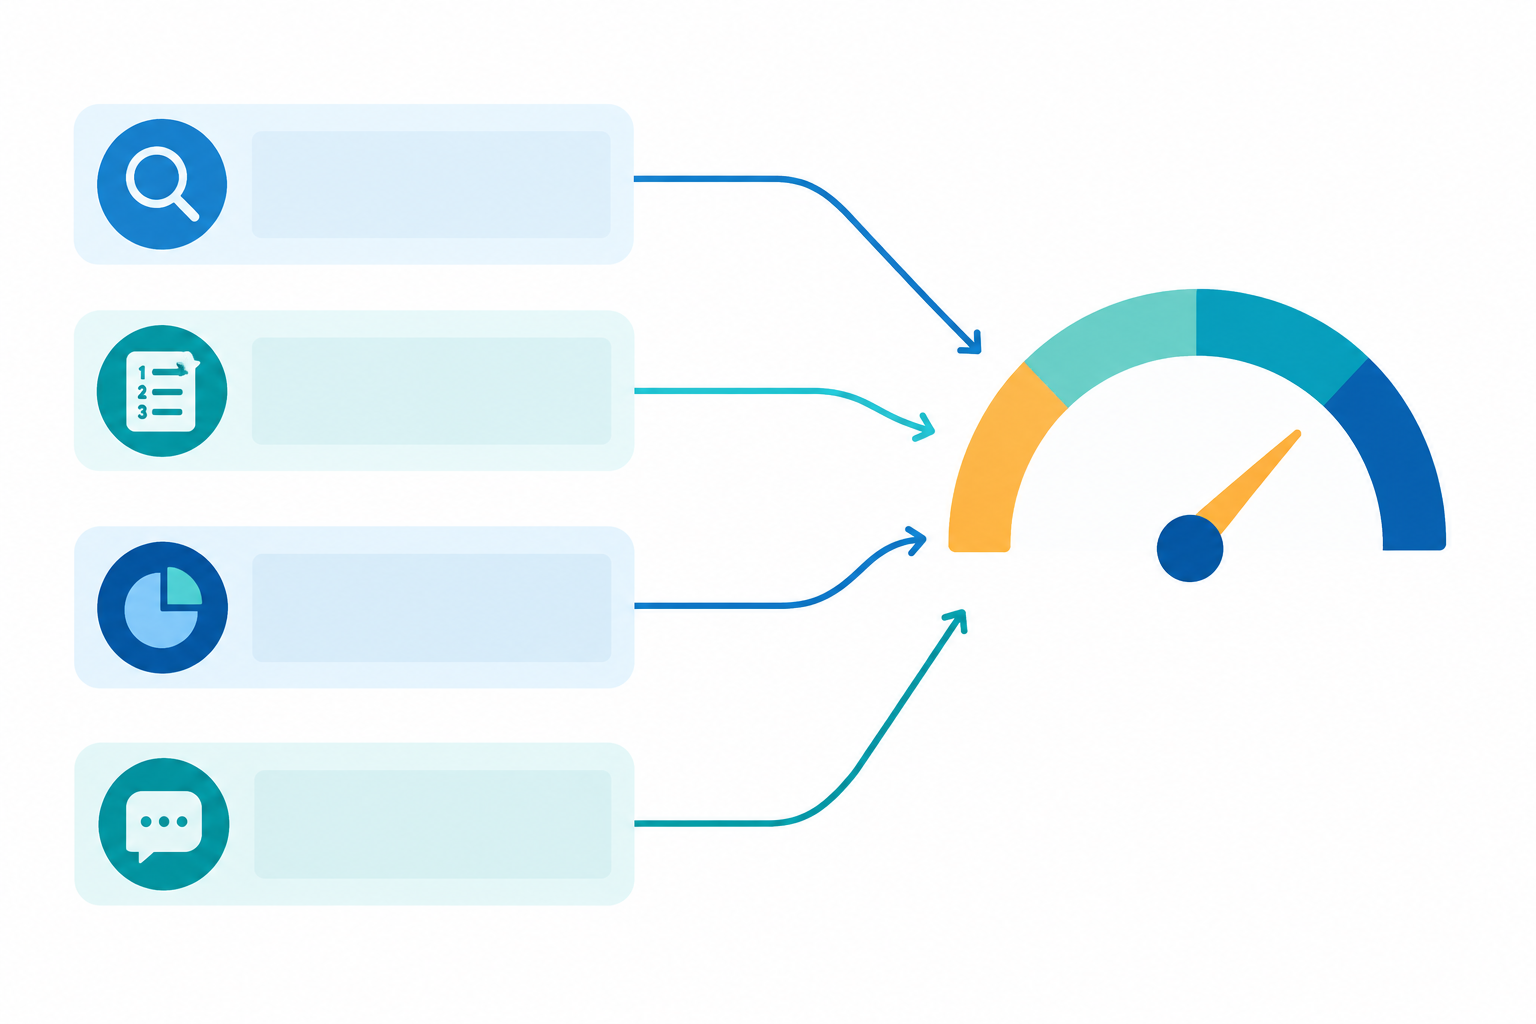
An AI visibility score condenses four signals into a single 0-100 figure: how many relevant questions mention you (query coverage), how prominently you are cited (position-weighted citations), how much of the conversation you own against competitors (AI share of voice), and how often you are named without a link (soft mentions). This guide explains what each of the four measures and how to read its movement. It does not reproduce a full composite formula, because MentionOwl, the tool I use as the worked example, does not publish its weighting. You cannot recalculate the headline number independently, and I won't pretend otherwise. What you can do is understand the component signals well enough to see which one moved, explain why, and report it with confidence.
Disclosure and scope. MentionOwl is the worked example throughout, and I work with it, so treat product-specific details as vendor descriptions, not industry standards. Where I give general advice, it applies to any tool. There is no standardised, industry-wide AI visibility score: tools sample different platforms, prompts and competitors, and they define visibility differently. A score only means something alongside its methodology.
Leadership wants one trend line, and marketing needs the components underneath it to act. A composite serves both audiences, provided you never report it without its parts. On its own it can hide the difference between being mentioned, being cited as a source, being recommended and being described favourably. A score that holds steady at 54 might mean coverage rose while citations fell, and those two situations call for very different responses.
Classic rank tracking gives you a position for a keyword on a given day. AI answers behave differently. They vary by engine, by phrasing and by day, and Google notes that results can differ by platform, location, language, personalisation and measurement date. A single snapshot is a weak basis for conclusions. Repeated sampling gives you many observations of the same question set, and aggregating them (a rolling seven-day average or a weekly median, for instance) shows whether the underlying direction is changing. The aggregation method matters, so ask any vendor how daily runs are combined into the figure you see, or record it yourself.
There is also a commercial reason to measure visibility separately from clicks. Pew Research Center analysed the browsing of 900 U.S. adults in March 2025 (68,879 Google searches) and found an AI summary on about 18% of searches. Users clicked a traditional result in 8% of visits when a summary appeared, against 15% when it did not, and only about 1% clicked a link inside the summary (Pew Research Center, July 2025). That describes U.S. Google behaviour, not UK behaviour, and it does not show that any brand's score drives revenue. Gartner has also forecast that traditional search engine volume will fall 25% by 2026 as users move to AI chatbots (Gartner press release, February 2024). It is a forecast, not a measured outcome.
MentionOwl states that it tracks ChatGPT, Claude, Gemini, Copilot and Perplexity. It crawls your website, auto-generates the customer questions your pages should answer, and runs them daily against each engine, recording the answer, citations, sentiment and competitor mentions. Covering several engines matters because buyers do not all use the same assistant. Before trusting a figure like this, I would ask the vendor how many prompts sit behind it, how often they are refreshed, which market and language settings are applied, and how runs are aggregated.
Any proprietary score is a model. Its value lies in consistent methodology and trend direction, not the absolute number. If the question set, engines, market or weighting change, treat that as a break in the time series, not as ordinary performance movement.
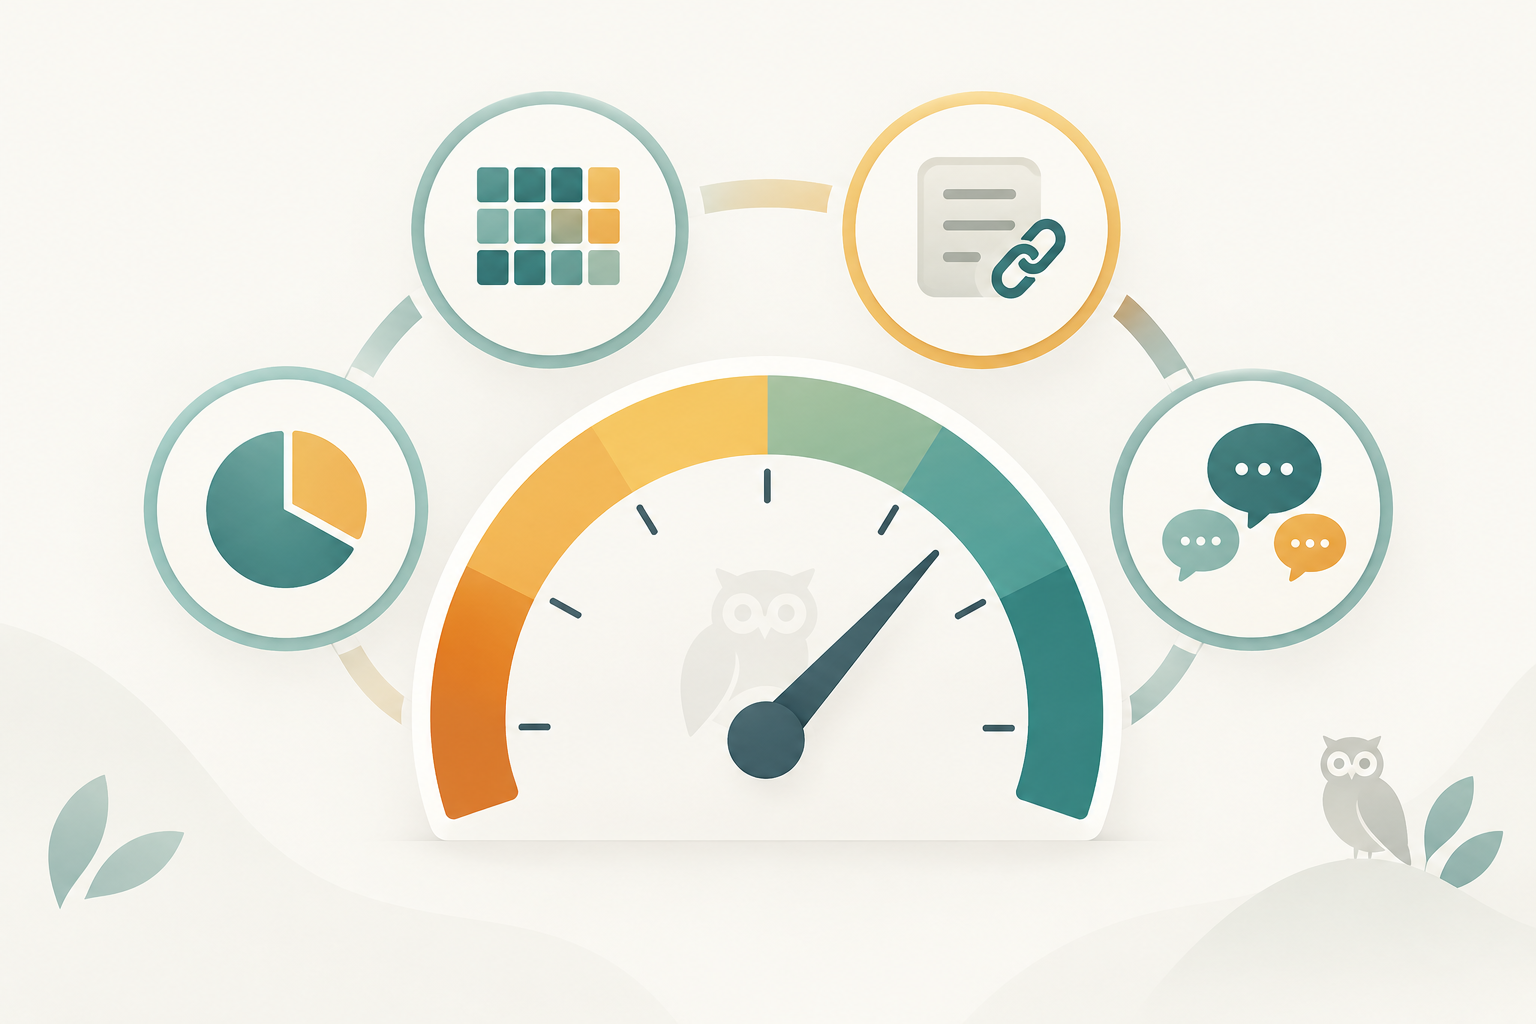
The four components combine into one score, but you should review them individually. To be precise about what is and is not public: MentionOwl does not disclose the exact weighting between components, nor every counting rule, so I won't invent them. The definitions below are the ones I use in this guide's worked examples. Where your tool's rules differ, document them in a methodology note.
| Component | What it measures | What a rise may mean | What a fall may mean | Who owns the fix |
|---|---|---|---|---|
| Query coverage | Share of tracked questions where your brand appears at all | You are surfacing for more buyer questions | Lost ground on topics, a stronger competitor page, a model change or a technical barrier | Content and SEO, with web development for technical issues |
| Position-weighted citations | How often and how prominently your pages are cited as sources; earlier positions count for more | Your pages are being cited earlier or more often | Thinner or dated pages, weaker structure, or a rival publishing original research | Content and PR |
| AI share of voice | Your portion of all brand mentions against named competitors | You are gaining relative to rivals | A competitor gaining, even if your own activity is unchanged | Marketing leadership and competitive intelligence |
| Soft mentions | Brand references without a citation or link | Possibly growing brand familiarity in AI answers | Possibly weaker third-party presence | PR, reviews and brand |
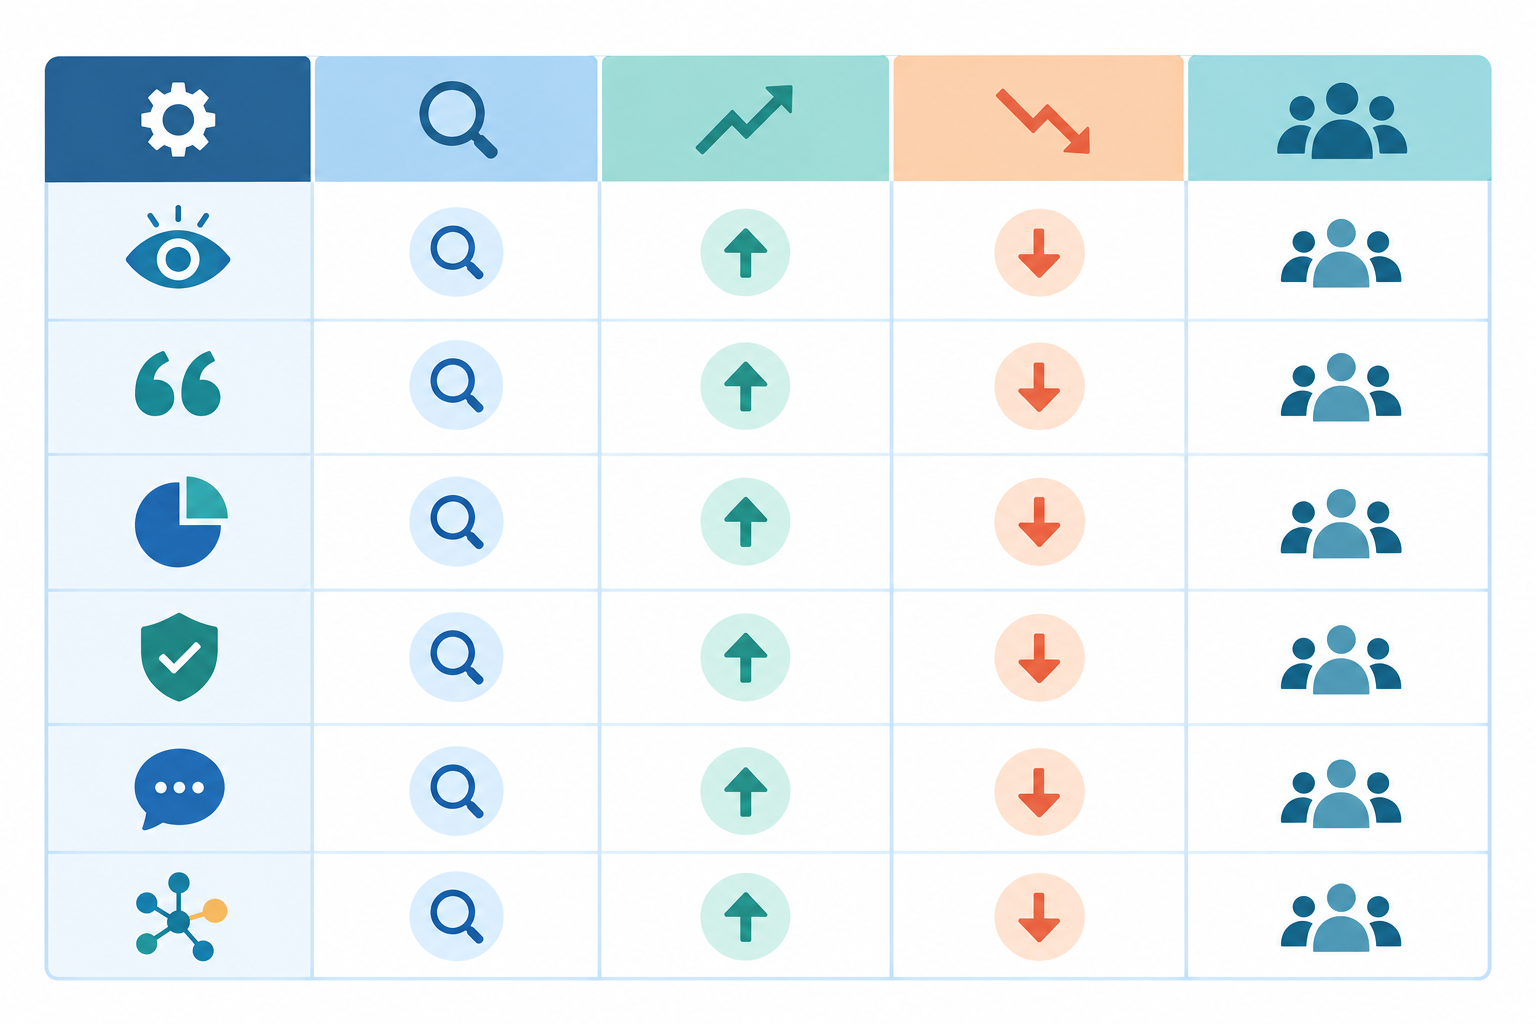
The "may mean" wording is deliberate. These are interpretations to test against your own data, not proven causes. I would put this table in your reporting pack as it stands, because it answers "what moved, and whose job is it?" before anyone asks.
Query coverage is the proportion of tracked questions for which your brand appears in an AI-generated answer. Take an illustrative example: 200 tracked questions, with your brand appearing in 56 answers, so coverage is 56 / 200 = 28%. The numerator is questions with at least one mention, the denominator is all tracked questions, and the sampling unit is the question, not each separate run. The result depends on the question set and on what counts as a mention, so document both.
Questions derived from your own website tend to reflect your own positioning. That is useful, but it can bias the set towards topics you already cover. I recommend validating a generated set against customer research, sales-call questions and independent category queries. A good set spans discovery, comparison and purchase stages, and you should report results by topic or intent as well as in aggregate.
This is also why I separate branded from unbranded questions. Suppose, illustratively, that 50 of your 200 questions name your brand and you appear in 45 of them, while you appear in 11 of the other 150. Headline coverage is 56 of 200, or 28%, but unbranded coverage is only 7.3% (11 of 150). Unbranded coverage is a useful indicator of discovery, because it shows whether people who do not yet know you are being introduced to you. It is still just one indicator, and it depends on how representative the unbranded questions are.
Coverage differs by engine, and one assistant lagging can drag the blended figure down, so review engines separately before drawing conclusions. Market and language matter too. Google's AI features are available in many countries and languages, and the Pew figures above are U.S.-only, so a result from one market should not be generalised to another.
For a UK business, that has practical consequences. Specify UK English in prompts ("accountancy software" rather than "accounting software", "trainers" rather than "sneakers"), set a UK location where the tool allows it, and name UK competitors, since a global rival that dominates US answers may barely register in UK ones. Report UK tracking separately from any US tracking, and note regulatory or seasonal context, such as the April tax year, when you interpret a movement.
In my experience of reviewing these reports, a coverage shift usually traces back to one of these:
Treat these as working hypotheses to check against the data. I am not claiming they rank in that order of likelihood.
Blocked crawlers, unclear structure or broken pages can suppress coverage regardless of content quality. MentionOwl's AI legibility audit runs 16 technical checks to surface such problems, and any technical SEO audit does the same job. Google states that its AI features rely on the same foundational SEO practices as its other Search features and need no special technical optimisation (Google Search Central), so in most cases the fix is ordinary good practice: indexable, accessible, genuinely useful pages.
A citation is a source your brand's page is credited as in an answer, usually shown as a link or footnote. Position-weighting gives earlier citations more credit than later ones. I treat this as a reporting heuristic, not a proven measure of influence. It is plausible that users give most attention to what they see first, but nobody has established how that plays out across AI engines, and the weights in any model are the publisher's methodological choice.
Classic search offers a useful but limited analogy. Backlinko's analysis of 4 million Google search results found the first organic result averaged a 27.6% click-through rate, against 15.8% for the second and 11.0% for the third (Backlinko). That shows order shapes attention in traditional search. It does not tell us that AI answers follow the same distribution.
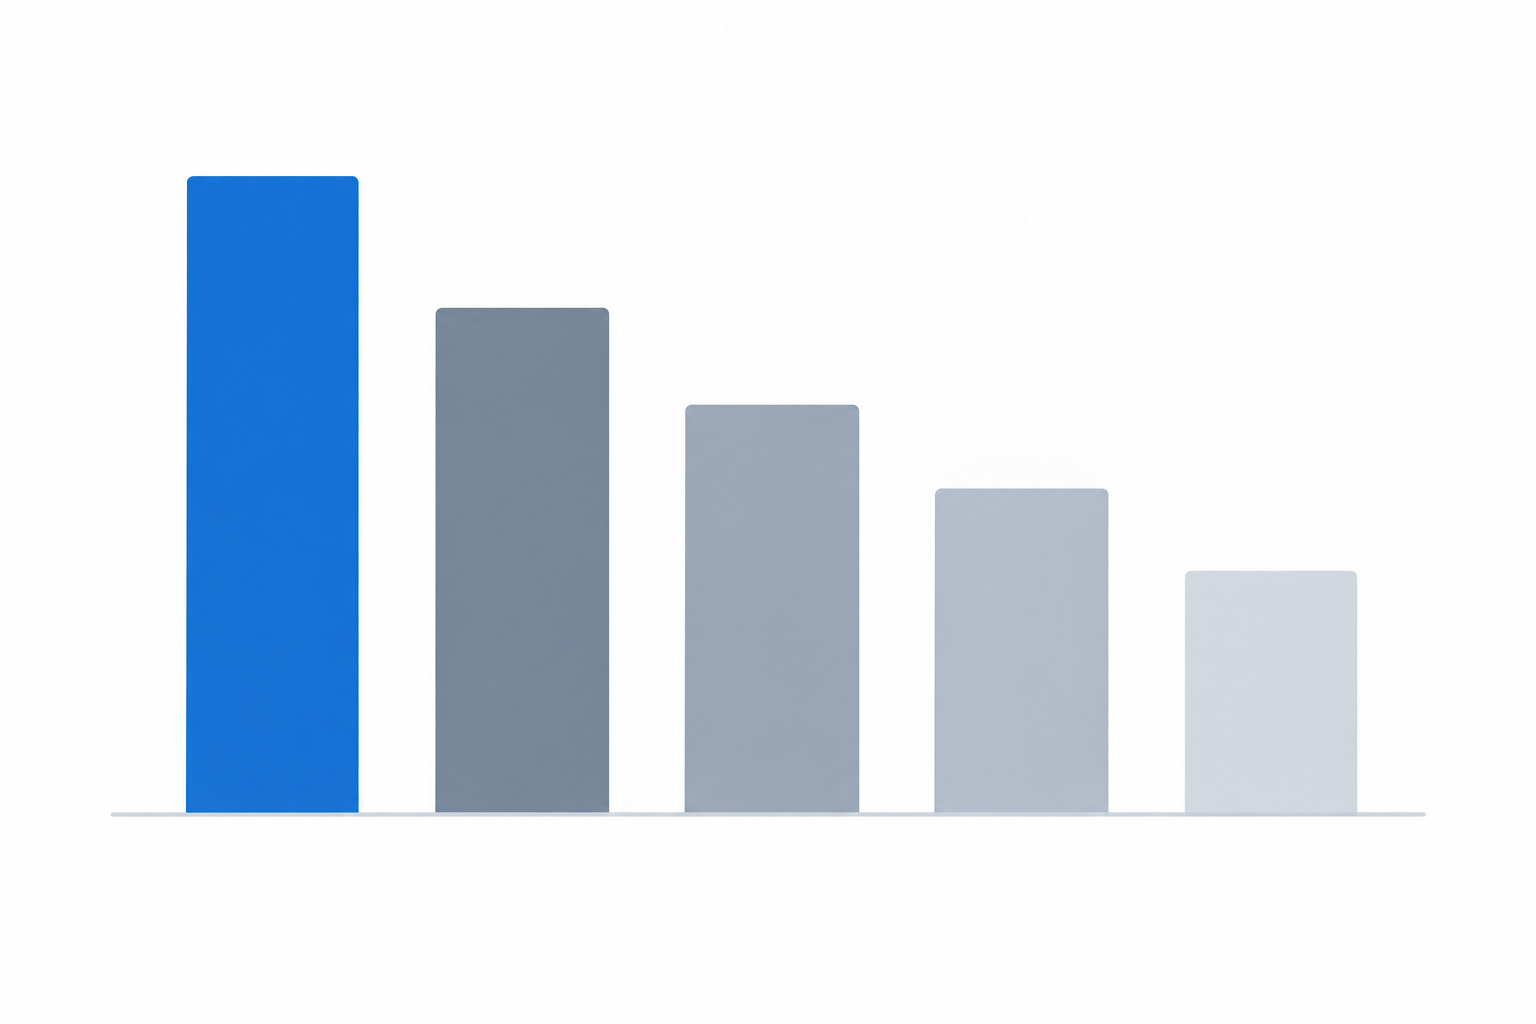
The weights below are an example only, not MentionOwl's actual weights:
Under these example weights, one first-position citation scores 1.0, while two citations in positions four and five together score 0.6. Frequency still counts, since three low-position citations (positions 3, 4 and 5) would total 1.1, but prominence changes the arithmetic considerably. That is why I recommend reporting raw citation counts and the position distribution alongside any weighted figure.
Citation frequency and citation quality are different things. Review which of your pages are being cited and which competitor pages win the questions you lose. When citations slip, check four things first: whether a rival's content is fuller than yours, whether your statistics are outdated, whether your structured data is weaker, and whether a competitor has added original research. In my own reviews, pages that earn early citations often have clear answers, original data and authoritative sourcing, but that is an observation from practice, not a finding from controlled research. The practical levers within generative engine optimization are answer-first formatting, original data, clear sourcing and well-structured pages, and all of them help human readers too.
AI share of voice is your mentions divided by total mentions of you and your tracked competitors across the same question set. Counting rules change the answer, so define them. In my examples, each brand counts once per answer (repeat mentions within a single answer are not added), and both cited and uncited mentions are included. If you are mentioned in 30 answers and three competitors in 45, 15 and 10, your share is 30 of 100, or 30%. It is a relative measure. It can rise because you appear more often, because competitors appear less, or because the tracked prompts changed, and on its own it does not establish traffic, leads or sales.
Your score can fall even when you have done nothing wrong, because a rival gained ground. Without competitor tracking you would see the dip but not the cause. Reporting share of voice as a trend against two or three named competitors, rather than as a standalone percentage, shows leadership whether the market is moving and not only whether you are.
A soft mention is your brand named in an answer without a link or formal citation, for example "Brand X is a popular option for…". Definitions vary between tools, and some use "soft" for descriptions that do not name the brand at all, so state your definition in your methodology note. In MentionOwl's model it means named but not linked.
Soft mentions may indicate that a model is familiar with your brand, and some practitioners expect them to come before citations as visibility matures. I would treat that progression as a hypothesis to test in your own data, not an established pattern. They carry less weight than a prominent citation, yet a named brand can still shape a buyer's shortlist.
A negative or caveated mention should not be reported as a win. A rising mention count with deteriorating sentiment is a warning, not progress. Record mentions, soft mentions, citations, prominence and sentiment separately, because AI answers vary between runs and blended figures can mask these differences.
Work through these steps in order. In my experience they usually isolate the likely cause quickly.
There is no universal benchmark, and I won't offer numeric thresholds because I have no market data to validate them. Scores are comparable only when the prompt set, platforms, locations and scoring method are aligned, so a good score is relative to your category and competitors. A niche UK business can lead a small category, while the same number may be much harder to reach in a crowded market with well-funded rivals.
Instead of bands, I recommend three habits. First, fix the comparison set: benchmark against a stable list of direct competitors on the same questions, platforms and market, and document it. Second, prioritise direction of travel by judging a rolling average over several weeks, not any single reading. Third, set component targets, such as raising unbranded query coverage by a set number of percentage points over a quarter.
Also segment results by topic, intent, market and engine. A brand can be strong on informational questions and weak on purchase comparisons, and a single grade would hide that.
These actions apply with any tool:
The most persuasive thing you can add to a leadership report is an annotation. A line reading "coverage fell four points after a competitor published a comparison guide; response page scheduled" turns a worrying number into a managed situation.
Vendor-specific note: MentionOwl offers a REST API and weekly digests for feeding data into existing dashboards, and cookieless AI traffic analytics for the traffic step above. Other tools offer comparable exports. Whichever you use, avoid maintaining a separate report.
There is no universal benchmark. Compare your score with direct competitors on the same questions, platforms and market, and track the trend over several weeks.
Identify which component moved, then check for a competitor gain, an engine update or a technical issue. Confirm the change against several weeks of data before treating it as a trend.
A soft mention is when an AI assistant names your brand without linking to or citing your website. It is usually weighted below a prominent citation.
SEO share of voice is typically based on keyword rankings. AI share of voice measures how often your brand is mentioned in generated answers against competitors across a defined question set.
Monthly suits most teams, with weekly monitoring for early warnings, because AI answers vary day to day.
A 0-100 figure is a useful summary, but its authority comes from the components beneath it and the consistency of the method behind it. Document your question set, engines, market and counting rules, report the components alongside the headline, and annotate every significant movement.
Product note: If you would like to see coverage, citations, share of voice and soft mentions broken out by engine, MentionOwl offers a $1 seven-day trial for establishing a baseline. 🦉
ChatGPT answers change with prompts, models and context. Learn how LLM monitoring, repeated sampling and daily AI visibility tracking reveal reliable trends.

I dug into the correlation between ChatGPT mentions, AI visibility scores, and actual trial signups. Here's what the traffic data reveals for SaaS and

When AI recommends a competitor, learn how to verify the pattern, find the cause, improve visibility, and track progress across major platforms.