Uptime Monitoring vs. APM: Which Does Your Team Need?
16 min read

Loading...
Uptime monitoring checks whether your website, API, or server is reachable and working from the outside. APM (application performance monitoring) helps explain why your code is slow or failing from the inside. If you're a small team, start with uptime monitoring. It's quick, fairly affordable, and catches the outages your customers actually notice. Add APM when you're chasing performance problems you can't explain from the outside.
This guide compares the two, shows where each one earns its keep, and covers what to look for when you're comparing products and what to set up first.
Picture it: it's 2am, and a customer emails to say your checkout is down. You open your dashboard and it's a wall of tidy graphs. CPU is fine, memory is fine, and the app's internal metrics look serene. Nothing paged you, because nothing inside the app knew anything was wrong. The customer found out before you did.
I've seen this happen to plenty of teams, and it's rarely because they lacked data. They had the wrong kind of data for that particular question.
Here's the cleanest way to separate the two:
So, is uptime monitoring the same as APM? No, and they aren't really competitors either. One is a smoke alarm. The other is the investigation kit you use after the alarm goes off. They show up at different points in an incident and suit different team sizes.
The easiest way to choose is to write down the questions you need answered on a bad day.
Uptime monitoring typically answers questions like:
APM typically answers questions like:
The first list is about whether the thing works for a user. The second is about why it does or doesn't work well on the inside. Product scopes vary, and some APM tools also offer availability or infrastructure signals, but application-level diagnosis is where APM is strongest.
Here's a side-by-side comparison of the two categories in general terms:
| Uptime monitoring | APM | |
|---|---|---|
| Primary question | Is it working? | Why is it slow or failing? |
| What it typically measures | Availability, status codes, content, response time, certificate and domain expiry, DNS records, job heartbeats | Traces, errors, slow queries, code-level performance, resource use |
| Where it runs | Outside, from external locations | Inside your application, usually via agents or SDKs |
| Who typically uses it | Developers, DevOps, agencies, freelancers, small businesses | Engineering teams running larger or more complex applications |
| Typical alert | "Your API has been down for 2 minutes, confirmed from three regions" | "Error rate on /checkout rose to 4% after the last release" |
| Time to value | Often minutes for a first monitor | Often days to weeks, depending on instrumentation and tuning |
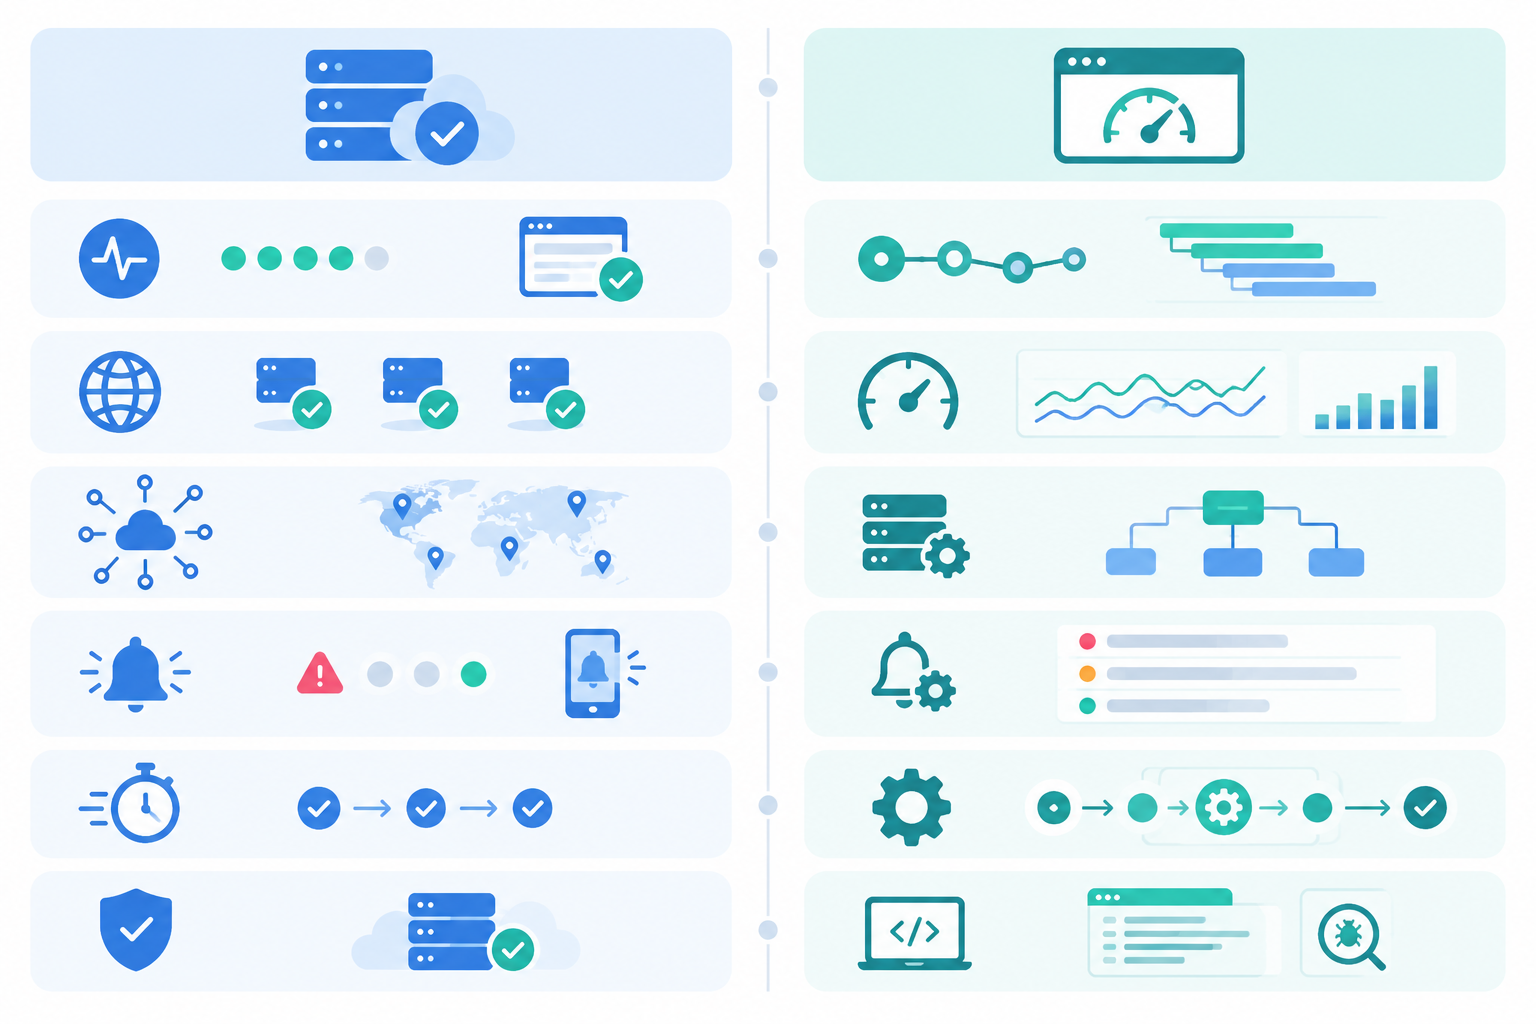
All of Moonitor's monitor types sit on the "is it working?" side of that table: HTTP/S, keyword, port, ping, SSL and domain expiry, heartbeat, and DNS change detection. That's deliberate. They're the checks that catch what customers notice first, and you manage them from a single dashboard.
This is the part that surprises people, so let's slow down.
Uptime monitoring checks your service roughly the way a user reaches it, from external locations. A request has to get through DNS, a CDN, TLS, a load balancer, and then your application before anyone sees a page. An external check can exercise that public route to the endpoint you've configured. That's why it can catch DNS failures, expired certificates, CDN issues, and network problems that internal tooling typically won't surface.
It has limits, though. A check tests the URL, content rule, or port you set up, from the probe locations you chose. It won't reproduce every user's journey, and anything behind a login needs deliberate configuration. Coverage is only as good as what you point it at.
APM agents live inside your application. They trace requests, profile code, and surface errors with stack-level detail. That's brilliant when you need to know that a particular function is hammering the database. It's far less helpful when the problem happens before a request ever reaches your code.
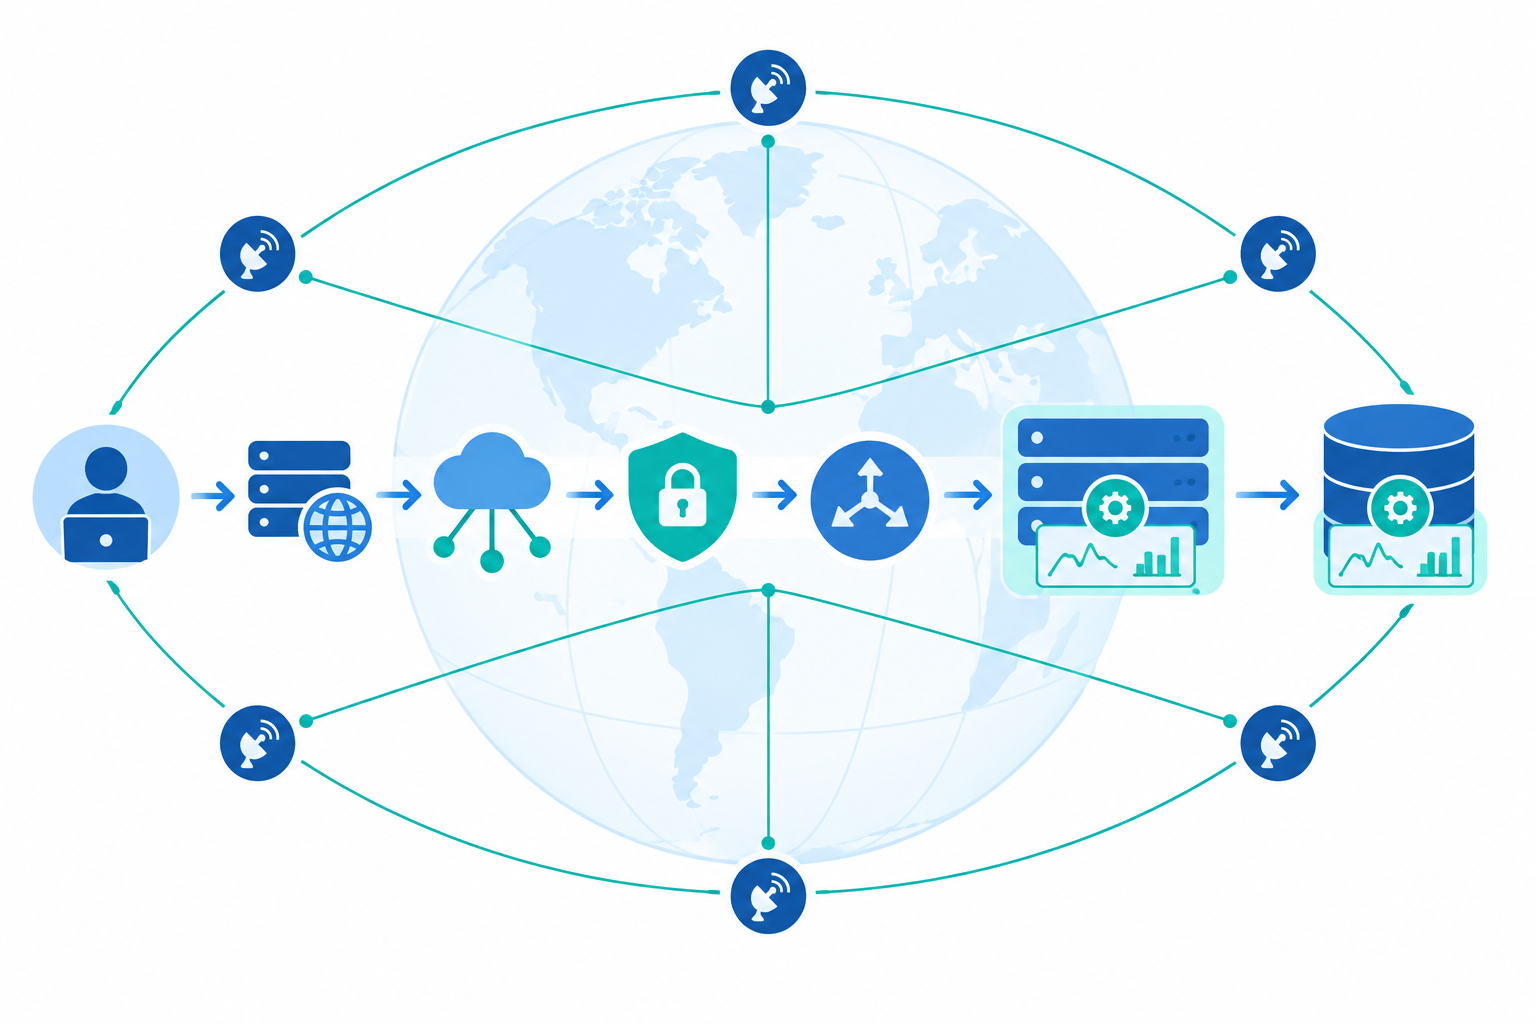
Sometimes, but not reliably on its own. Capabilities vary by vendor, and some platforms add synthetic checks or infrastructure alerts. But a classic APM agent reports from inside the app. If the app or server is fully down, it may have nothing to send, and silence looks a lot like "no errors". APM also typically can't diagnose upstream problems like a DNS misconfiguration or an expired certificate, because those happen before traffic reaches your code.
Here's a story that's depressingly common. A team's SSL certificate expires on a Saturday. Browsers start showing scary warnings and most visitors bounce. Meanwhile the application server is healthy, handling the few requests that get through, with normal latency and no errors. The first the team hears of it is a customer message on Monday morning. An external SSL certificate monitor would have warned them weeks earlier. A DNS record change works the same way: one quiet edit, and your site is offline for some users while everything inside looks fine.
There's a catch with outside-in checks. A single probe can hit a transient network blip and cry wolf. Do that a few times and your team learns to ignore alerts, which is exactly when a real incident slips by. Moonitor confirms a failure from several regions before it alerts you, so the signal stays trustworthy. A quiet alert that people believe is worth more than a noisy one they mute.
Let's be honest about the practical side, because for a small team this often decides things. I'll keep the comparison general rather than quoting other vendors' figures, since pricing changes often and you should check current numbers yourself.
| Uptime monitoring | APM | |
|---|---|---|
| Setup effort | Typically a URL and an alert channel; a first monitor often takes a few minutes | Agent or SDK installation, instrumentation, sampling and dashboard tuning |
| Pricing model | Often driven by the number of monitors and check frequency; flat tiers are common | Often based on hosts, telemetry volume, retention, or users, so it can grow as you add data |
| Ongoing overhead | Generally low: choose channels, tune a few thresholds | Generally higher: dashboards, sampling decisions, data retention, alert rule upkeep |
| Footprint in your app | Does not require an agent in the monitored application; checks run from outside | Agents run inside your app and can add some overhead |
| Data privacy | Checks typically see only public responses | Traces can contain personal data, which matters for UK GDPR |
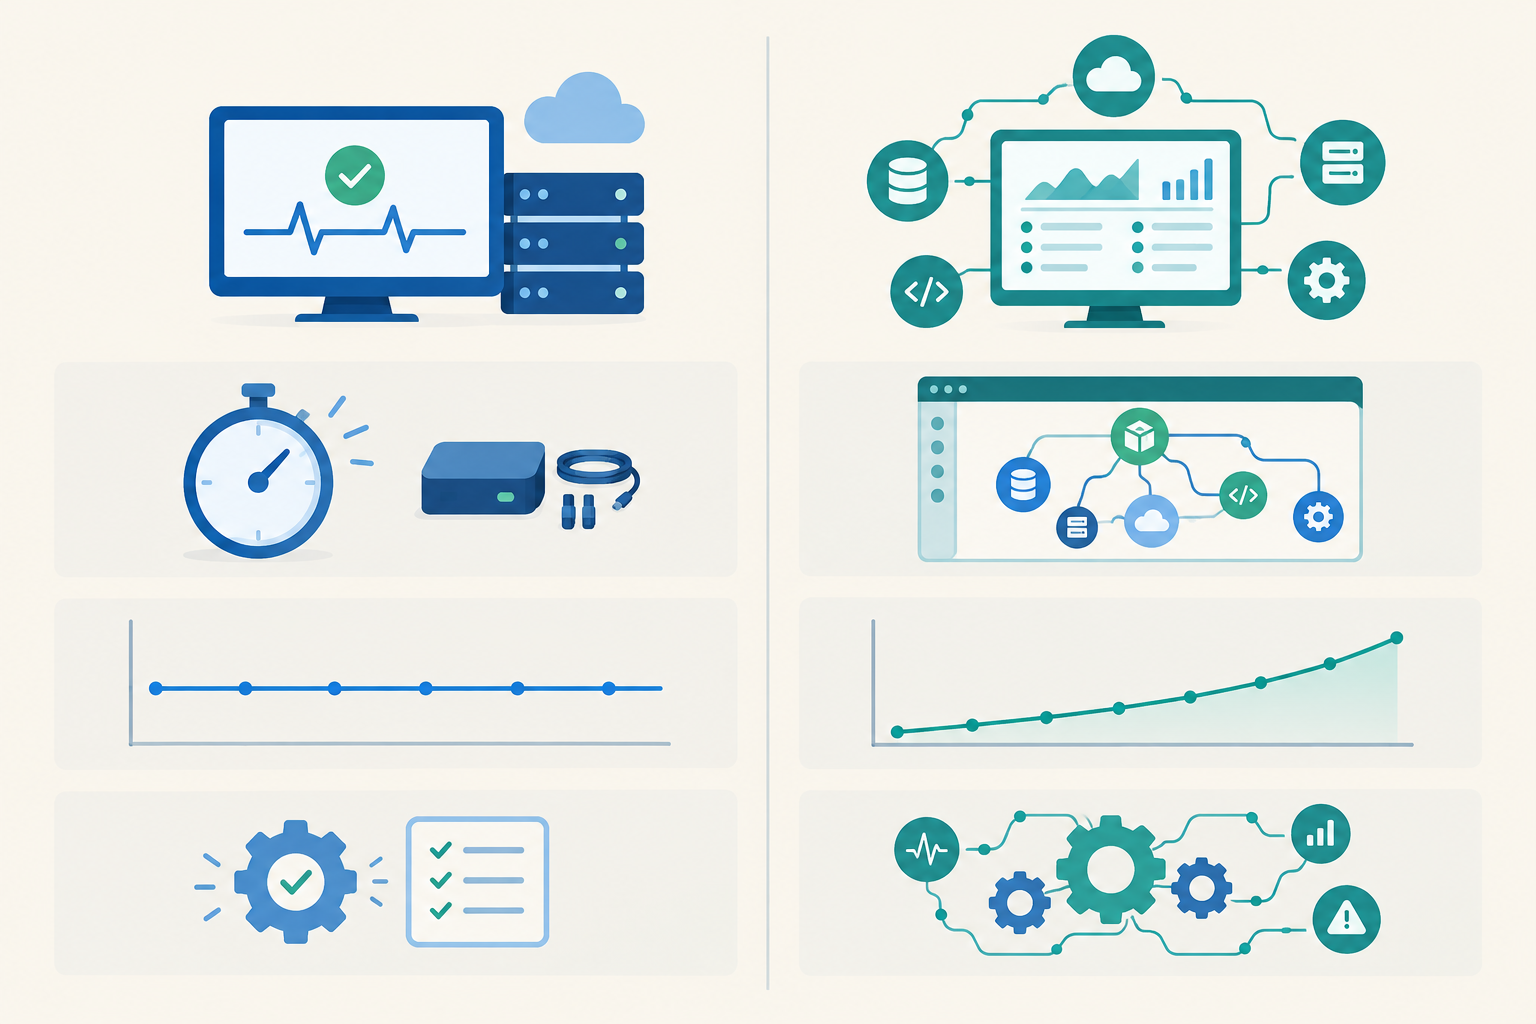
Uptime monitoring tends to be easier to budget for. Moonitor, for example, lists its Solo plan at $14/mo for 20 monitors and its Max plan at $49/mo for unlimited monitors. Those are US dollar prices and they can change, so please check Moonitor's pricing page for the current plans, currency, and limits before you decide. If you're budgeting in pounds, work from the price you're actually quoted at checkout, including any VAT, rather than a rough conversion.
APM is a different shape. Many APM products price on hosts, data volume, or events, which can climb as you add services, traces, and logs. When you compare, look at each vendor's pricing units against your expected usage, not just the headline plan price. A cheap-looking entry tier can behave very differently once your traffic grows.
The invoice isn't the whole story. APM needs instrumented services, managed telemetry volume and sampling, useful service views, and maintained alert rules. Tools like OpenTelemetry offer vendor-neutral instrumentation, which can make switching backends easier, but they don't remove the work of collecting, governing, and interpreting the data. It's an ongoing commitment, not a one-off install.
Whichever category you're shopping in, these questions help cut through feature lists:
If you handle personal data, remember that traces and logs can capture things like user IDs, email addresses, or request bodies. Under UK GDPR you'll want to know what a tool collects, where it's stored, and how long it's kept. Ask any vendor about data location, retention terms, and their data processing agreement, and read their documentation rather than assuming. Uptime checks against public endpoints rarely raise the same questions, which makes them a lighter starting point.
Outages can be expensive. Uptime Institute's Annual Outage Analysis 2024 reported that 54% of respondents said their most recent significant outage cost more than $100,000. The survey covers operators of data centres and digital infrastructure, often much larger than a typical small team, and the figure says nothing about any one product's ability to prevent outages. Monitoring doesn't stop failures. It shortens the time between something breaking and you knowing about it. If you cite this figure yourself, check the report directly for the survey definitions.
Can you skip APM as a small team? Usually, at least at first. Uptime monitoring is likely all you need if:
One tool can cover a lot of ground:
For example, a small API with a handful of endpoints might need one HTTP check on a health endpoint, one keyword check on a key response, a certificate monitor, and a heartbeat for its nightly job. That's the whole setup, and it doesn't touch your codebase.
There is a limit, though. Response-time data tells you when something got slower, not why. When you can see the drift but can't explain it, that's your cue for the next section.
APM is a great tool. It just needs the right moment. These are the signals I'd look for:
APM only pays off if someone has time to look at it. Don't buy it just because it feels like the "grown-up" option. A beautifully instrumented system that nobody opens is an expensive screensaver. If you do start, begin with your most critical or most troublesome service rather than everything at once.
You want one loud, trustworthy alarm, then good tools to work out what burned.
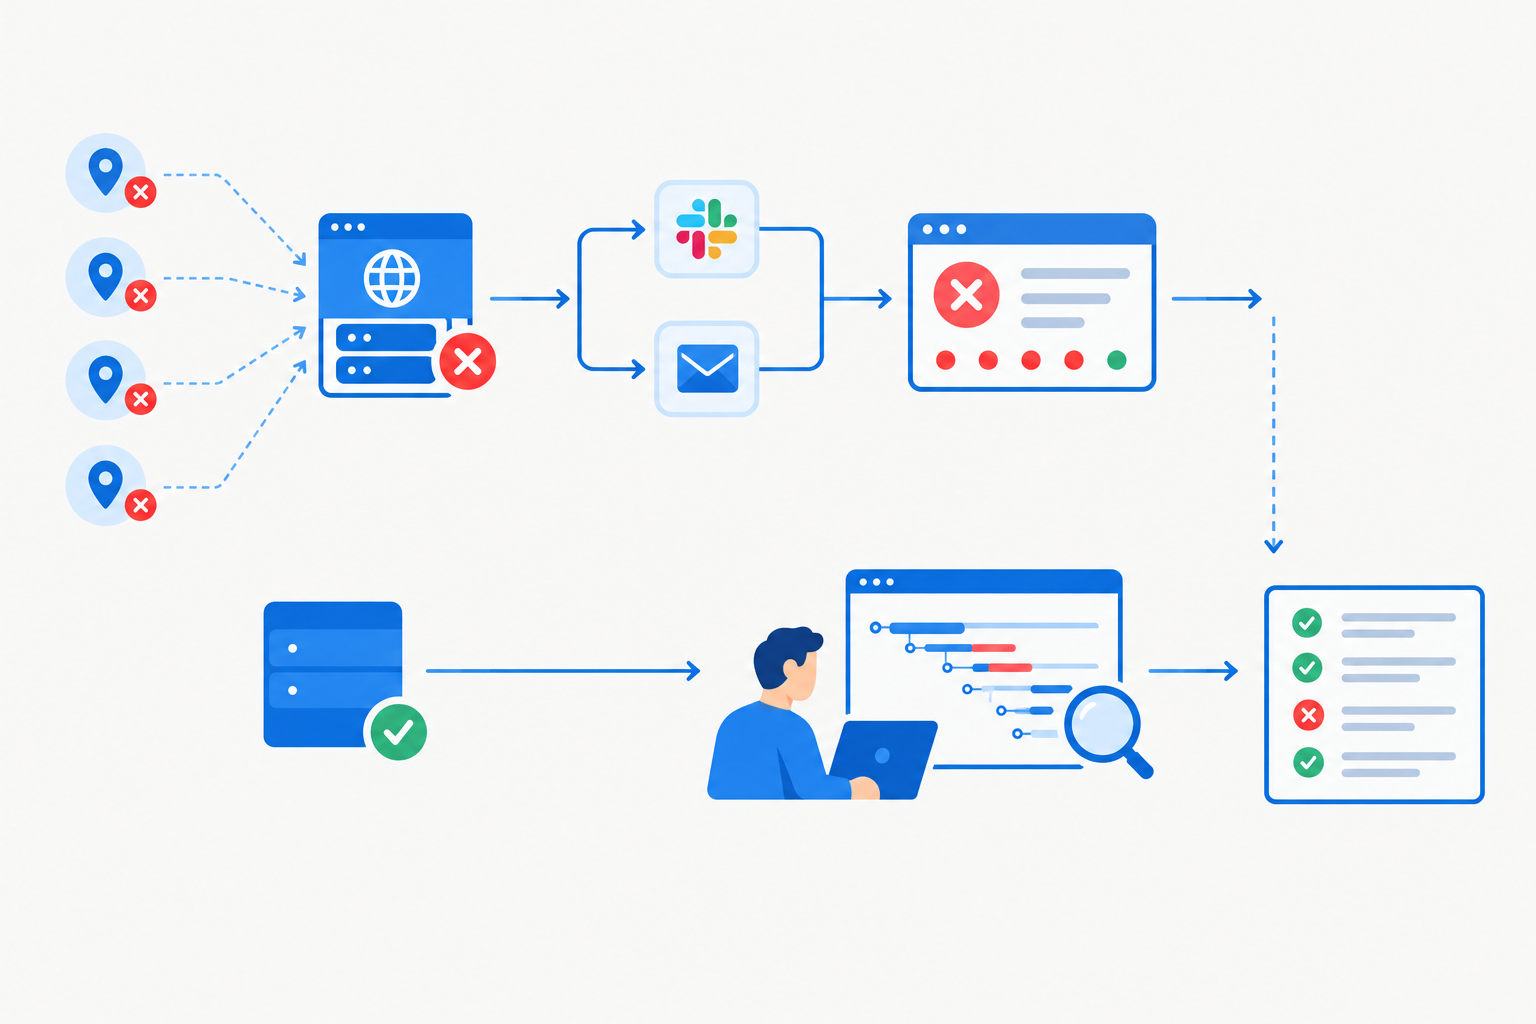
A few principles keep this from turning into alert soup:
Here's what that looks like in practice. Say an online shop's checkout starts failing:
Detection and diagnosis are two separate jobs, and treating them that way is what makes the pairing work. (This is an illustrative scenario rather than a specific company's setup, but it's a pattern you'll probably recognise.)
If you're staring at a blank dashboard, here's the order I'd go in:
If you'd like a low-risk way to get step 1 done, Moonitor offers a free trial (currently 7 days, no credit card required; do check the current terms on the site). It's an easy way to see what outside-in visibility feels like on your own stack.
No. Uptime monitoring checks from the outside whether your website, API, or server is reachable and responding correctly. APM runs inside your application and shows why it's slow or throwing errors. They answer different questions and work best together.
Often, yes. If your biggest risks are outages, expired certificates, failed cron jobs, or DNS changes, uptime monitoring covers them. Add APM later, when performance problems appear that you can't explain from the outside.
Not reliably on its own. If your app is completely unreachable, an agent may have nothing to report, and APM typically can't diagnose external issues like DNS failures or expired SSL certificates. Some vendors bundle availability checks, so look at what your specific product includes. An external uptime check is the dependable way to catch these problems.
Start with uptime monitoring on your most important pages and API endpoints, then add SSL, domain, DNS, and heartbeat checks. The roadmap above has the full order.
Yes, most record response times on every check, so you can spot slowdowns and trends over time. They won't pinpoint the line of code responsible, but they will tell you when something has started to drift.
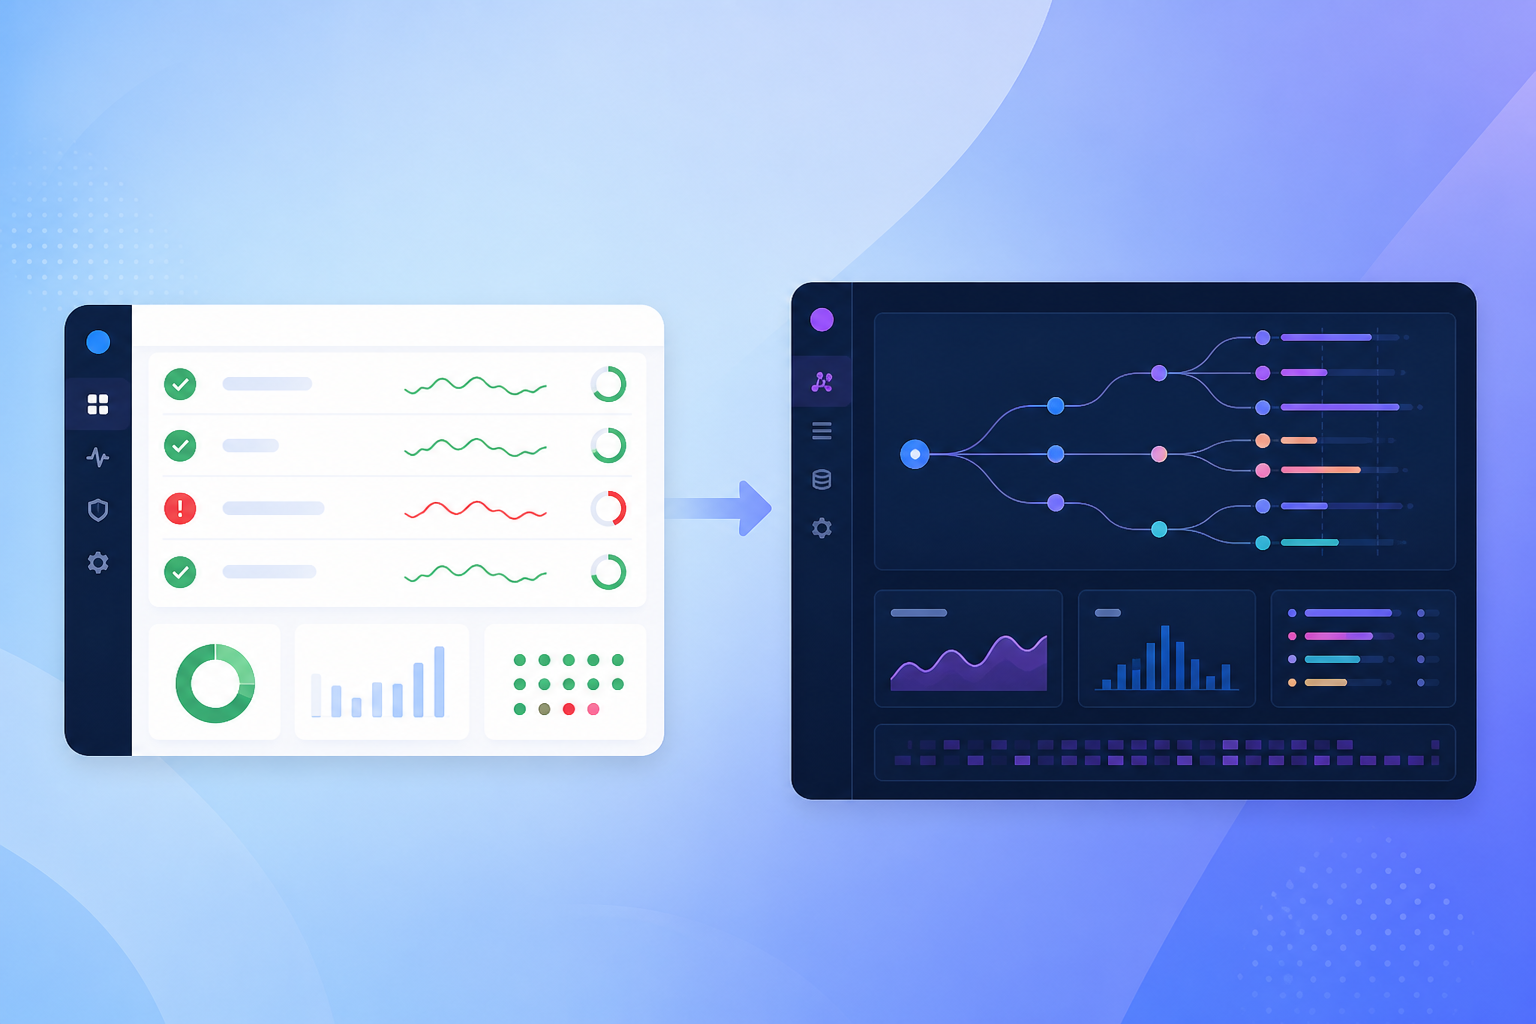
Confused about uptime monitoring vs APM? We break down what each actually tracks, when you need both, and how to choose based on your team size and bu
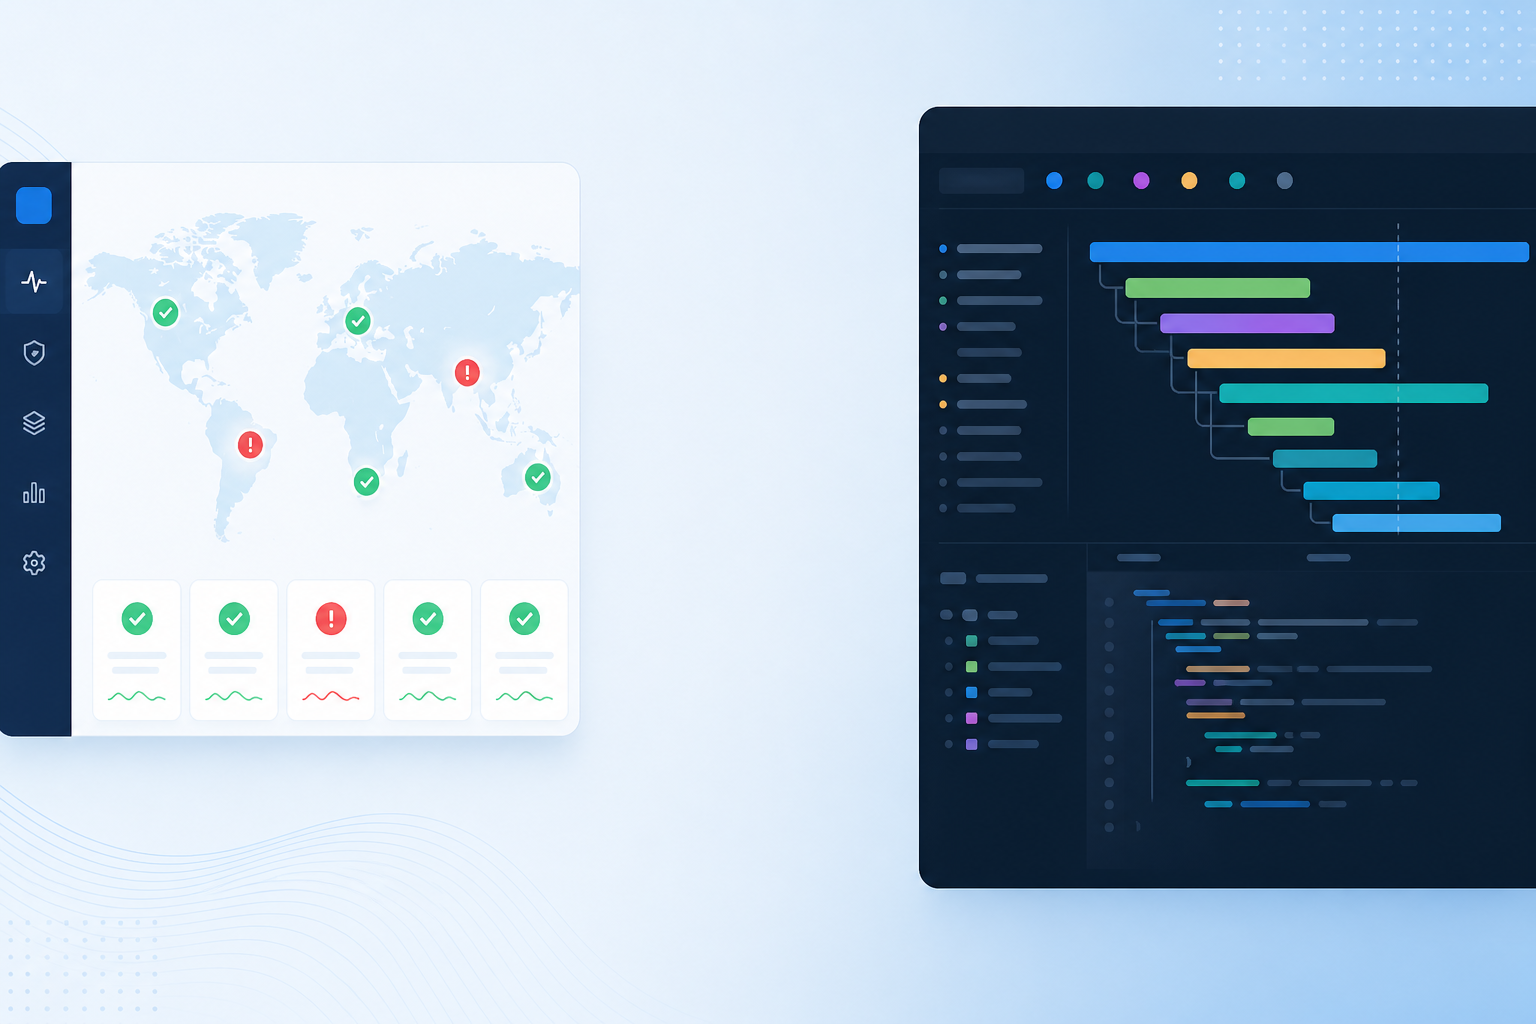
Confused about uptime monitoring vs APM? We break down what each tool measures, when to use one, both, or neither, with a side-by-side comparison for
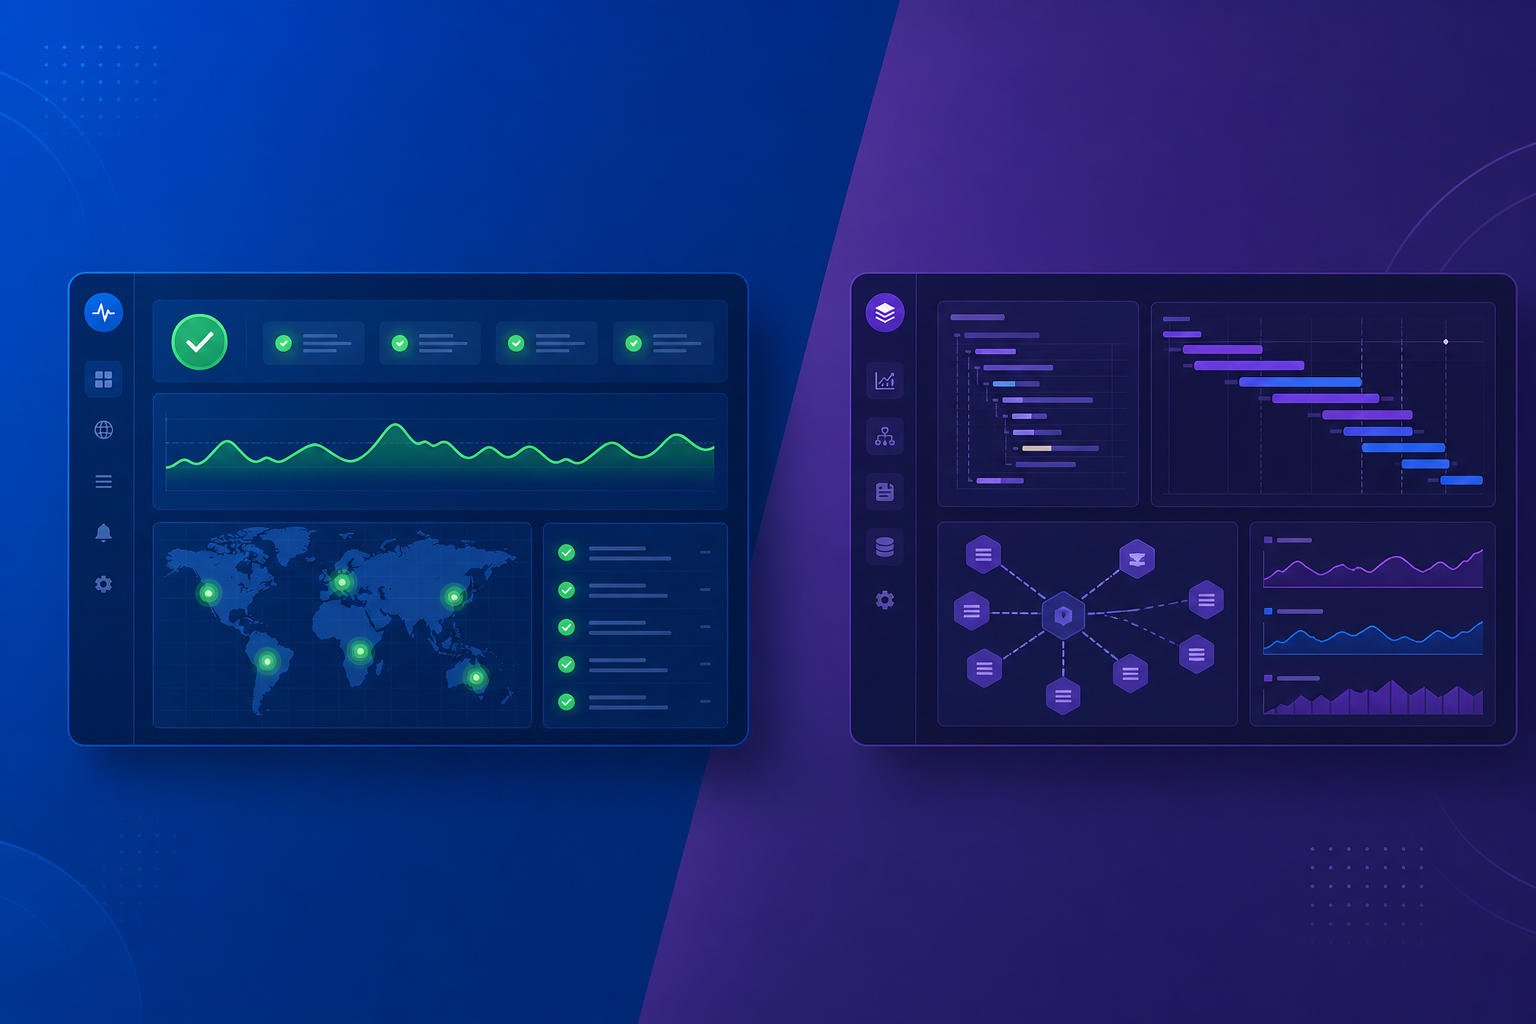
Uptime monitoring vs APM: compare external checks, application performance monitoring and response time analytics to build the right monitoring stack.