How E-commerce Brands Can Improve Their AI Citation Rate
18 min read

Loading...
Your AI citation rate is the percentage of relevant shopping queries where an AI engine such as ChatGPT, Perplexity or Gemini explicitly attributes information to your brand. It's a measurable KPI, not a vague aspiration. It has a baseline, it responds to specific inputs, and you can track it over time against named competitors.
Improving it comes down to three things: restructuring product pages so they contain concrete, citable specifics; publishing honest comparison content that names competitors instead of avoiding them; and testing changes against a consistent baseline over several weeks rather than reacting to daily noise. This sits under a broader discipline sometimes called generative engine optimisation: adapting content for AI-mediated discovery rather than only for traditional search rankings.
A methodology note before I start: no AI provider publishes an official citation formula, and nobody, including me, has full visibility into every platform's retrieval logic. What follows combines a measurable tracking method you can run yourself with patterns I've observed working across e-commerce accounts. I've tried to flag which is which throughout, rather than presenting observation as proof.
AI citation rate is the percentage of tracked, relevant queries in which an AI engine attributes a specific claim, recommendation or piece of information to your brand. The formula is:
Citation rate = (queries where your brand is cited ÷ total tracked query-platform runs) × 100
The denominator matters. If you're tracking 50 queries across five platforms, that's 250 query-platform runs, not 50 queries. Report it that way, or you'll inflate your own numbers without meaning to.
Before calculating the rate, define which runs are eligible and keep those rules consistent. A query should be excluded only when the platform fails to return an answer, the test cannot be completed, or the result is clearly unrelated to the intended market. Don't quietly remove runs where your brand is absent: those are part of the denominator. Record the query, platform, date, location, logged-in state, answer, visible sources, brand status and competitor status in the same sheet. That audit trail makes later comparisons more reliable and helps separate a genuine change from a different test setup.
Say Perplexity answers "best running shoes for flat feet" with: "According to [Your Brand]'s fit guide, models with structured arch support are recommended for overpronators." That's a citation: a specific claim tied to your brand as the source. If it instead lists "Options include Brand A, Brand B and Brand C," that's a mention. Your name appears, but nothing is attributed to you. Share of voice is a third, separate metric: your brand's share of all brand appearances across a category of queries.
You can have strong share of voice while having a weak citation rate, because you're showing up in lists but rarely treated as the source behind a specific claim.
| Metric | What it measures | Typical denominator |
|---|---|---|
| Mention | Brand name appears anywhere in the answer | Tracked queries |
| Citation | Brand is attributed as the source of a specific claim | Tracked query-platform runs |
| Share of voice | Your brand's share of all brand appearances in a category | Total brand mentions across competitors |
Conflating these three is one of the most common errors I see when brands first start measuring AI visibility.
This is the part most articles on this topic gloss over, and it's worth being precise about, because "citation" doesn't mean one consistent thing across AI engines. Perplexity and Copilot tend to show explicit source links you can point to. ChatGPT's browsing and non-browsing modes behave differently from each other, and its underlying attribution often isn't visible to the end user. Gemini sits somewhere in between, depending on whether it's drawing on live search grounding.
Rather than treating "citation" as one bucket, I log four distinct event types when I track AI citation rate:
For a citation rate calculation, I count only (1) and (2) in the numerator, and report (3) separately as an "inferred use" figure rather than folding it in. It's suggestive, not verifiable. Report figures by platform rather than blending them into one number, since a blended rate can hide that you're strong on Perplexity and invisible on ChatGPT.
Why this is hard to track manually: checking even 30 buying-intent queries across four platforms is 120 checks per round, repeated regularly to see a trend rather than a snapshot, with no standard logging format provided by any platform. You can run this in a spreadsheet with a recurring calendar reminder; it just takes discipline. Automated tools remove the repetitive checking. They don't change the underlying formula.
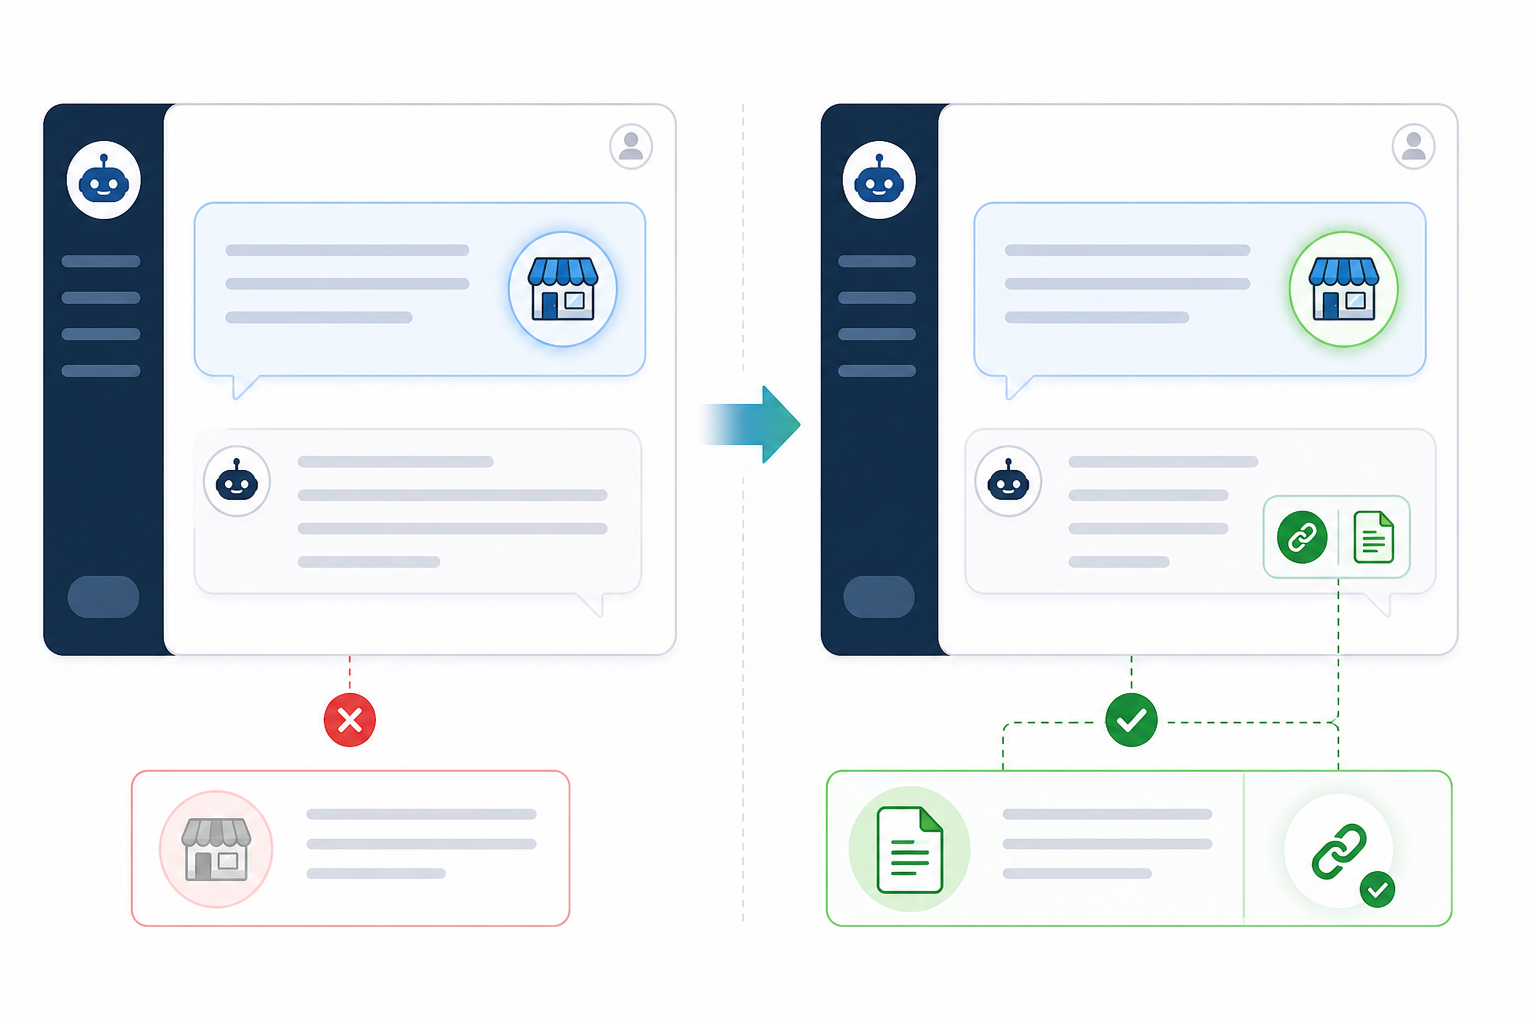
A caveat before this list: these are patterns I've observed rather than proven causal levers. Category competitiveness, domain trust and platform-specific retrieval behaviour all play a role too, and I don't have a controlled study isolating any single factor. Treat these as testable hypotheses, ranked roughly by expected impact relative to effort.
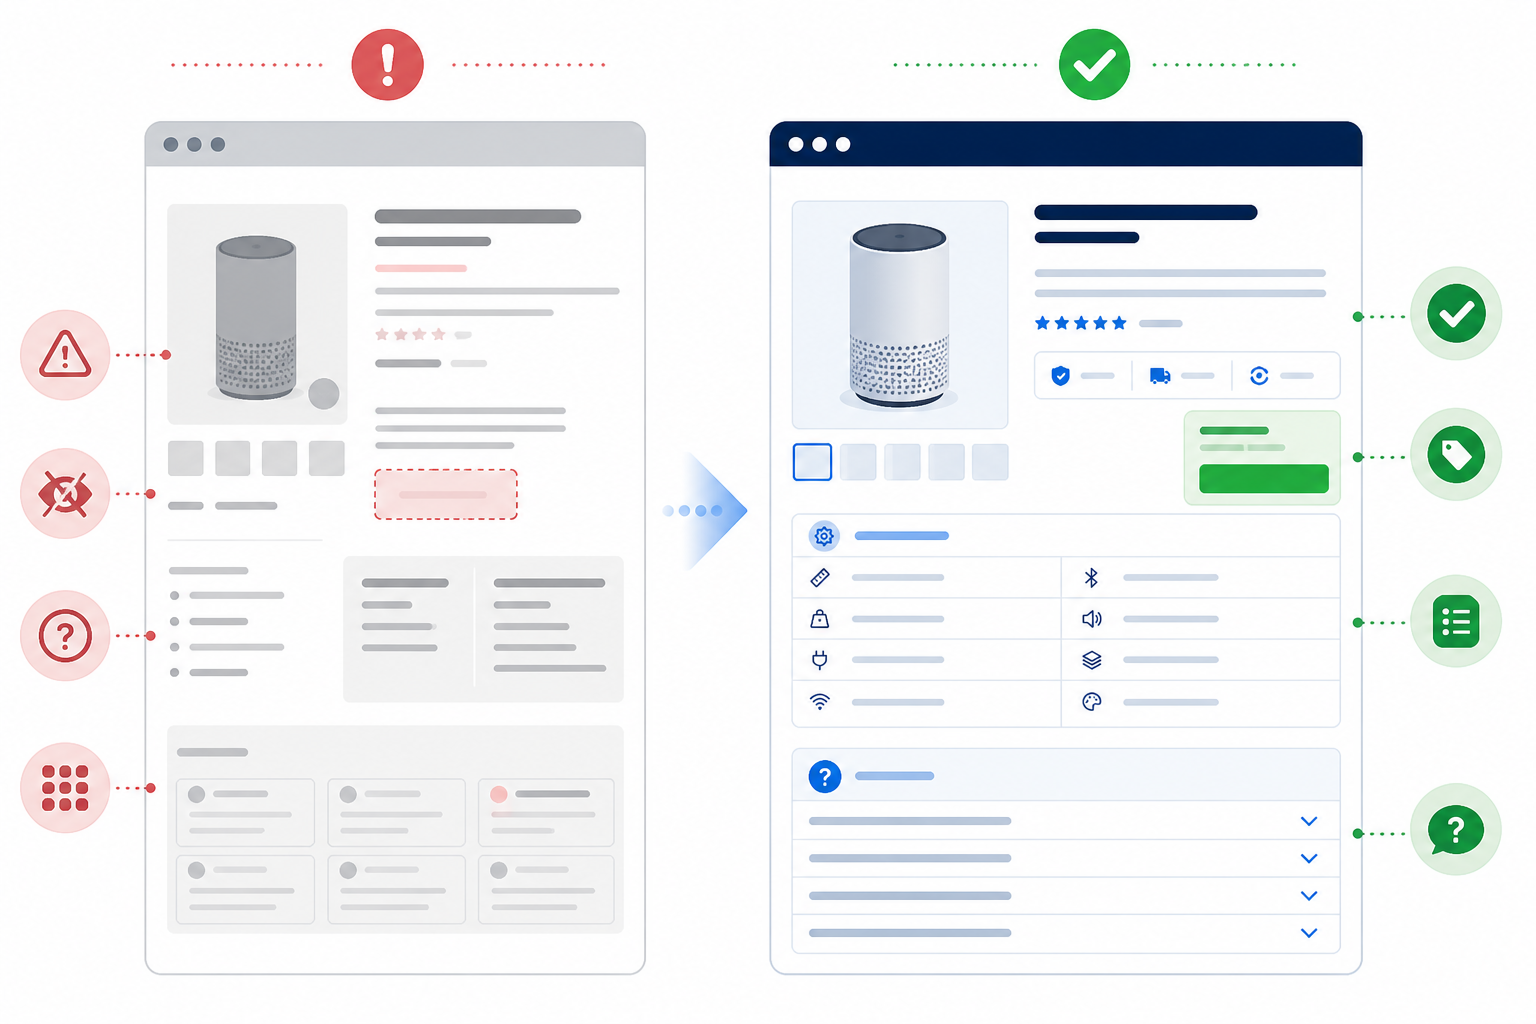
Here's a pattern I've seen repeatedly: content that names and compares multiple options, including direct competitors, tends to outperform single-brand marketing pages for comparative queries specifically. This isn't a universal law so much as a reasonable fit between query type and content type. A user asking "best budget espresso machine" wants a comparative answer, and a page discussing only one product doesn't give a model the comparative structure it needs to construct that response, however well-written the page is.
This means the highest-value content for AI citation purposes often isn't your product page at all. It's your own "best X for Y" or "X vs Y" content, provided it's genuinely useful rather than thinly disguised self-promotion.
Competitor tracking is useful here too, not as a vanity dashboard, but to see which comparison angles rivals are winning on, such as price, a specific feature or delivery speed. This helps you find the actual content gap rather than guessing.
Treat this as an experimental process, not a one-off content push.
Fix a set of 30-50 buying-intent queries, but don't treat that as one homogeneous sample. Segment it by intent (comparison queries, specification lookups and "best for X" queries), by product category if you sell across several, and by brand versus non-brand phrasing.
Run the same set across your priority platforms, logged out, in the same location setting and on the same day if possible. Record three separate columns: your AI citation rate, your top two named competitors' citation rate on the identical queries, and share of voice across the category.
A 30-50-query set is a reasonable starting diagnostic. It isn't large enough to draw firm statistical conclusions once split across platforms and intents, so treat early numbers as directional.
If you restructure product pages, publish new comparison content and fix crawler access in the same week, you won't be able to attribute any movement to a specific cause. Sequence changes so you can identify which improvements affect your results.
Day-to-day answers fluctuate for reasons unrelated to your content: model updates, retrieval variability, query phrasing and whether a session uses browsing mode. A single day's dip or spike is close to meaningless. A rolling four-week average tells you far more.
Report AI citation rate, competitor citation rate and share of voice as three separate figures, not blended into one score. A citation rate that climbs from 8% to 12% is progress on its own terms; whether it's relative progress depends on what happened to your named competitors' citation rate over the same queries in the same window.
Layer sentiment on top once volume is established. Being cited and being cited well are different problems. A brand cited frequently but described as "budget" next to a competitor described as "premium and reliable" needs a different fix from a brand that isn't being cited at all.
In the accounts I've tracked, four to eight weeks is a realistic window to run one full test cycle and see the first measurable movement. I want to frame that carefully as an operational testing window, not a claim about how quickly any platform recrawls the web, since no provider publishes that schedule.
ChatGPT in particular can lag behind Perplexity and Copilot's more live-retrieval-driven behaviour. I'd treat any claim of a faster universal timeline with scepticism. This is an emerging measurement area without long-run independent studies yet.
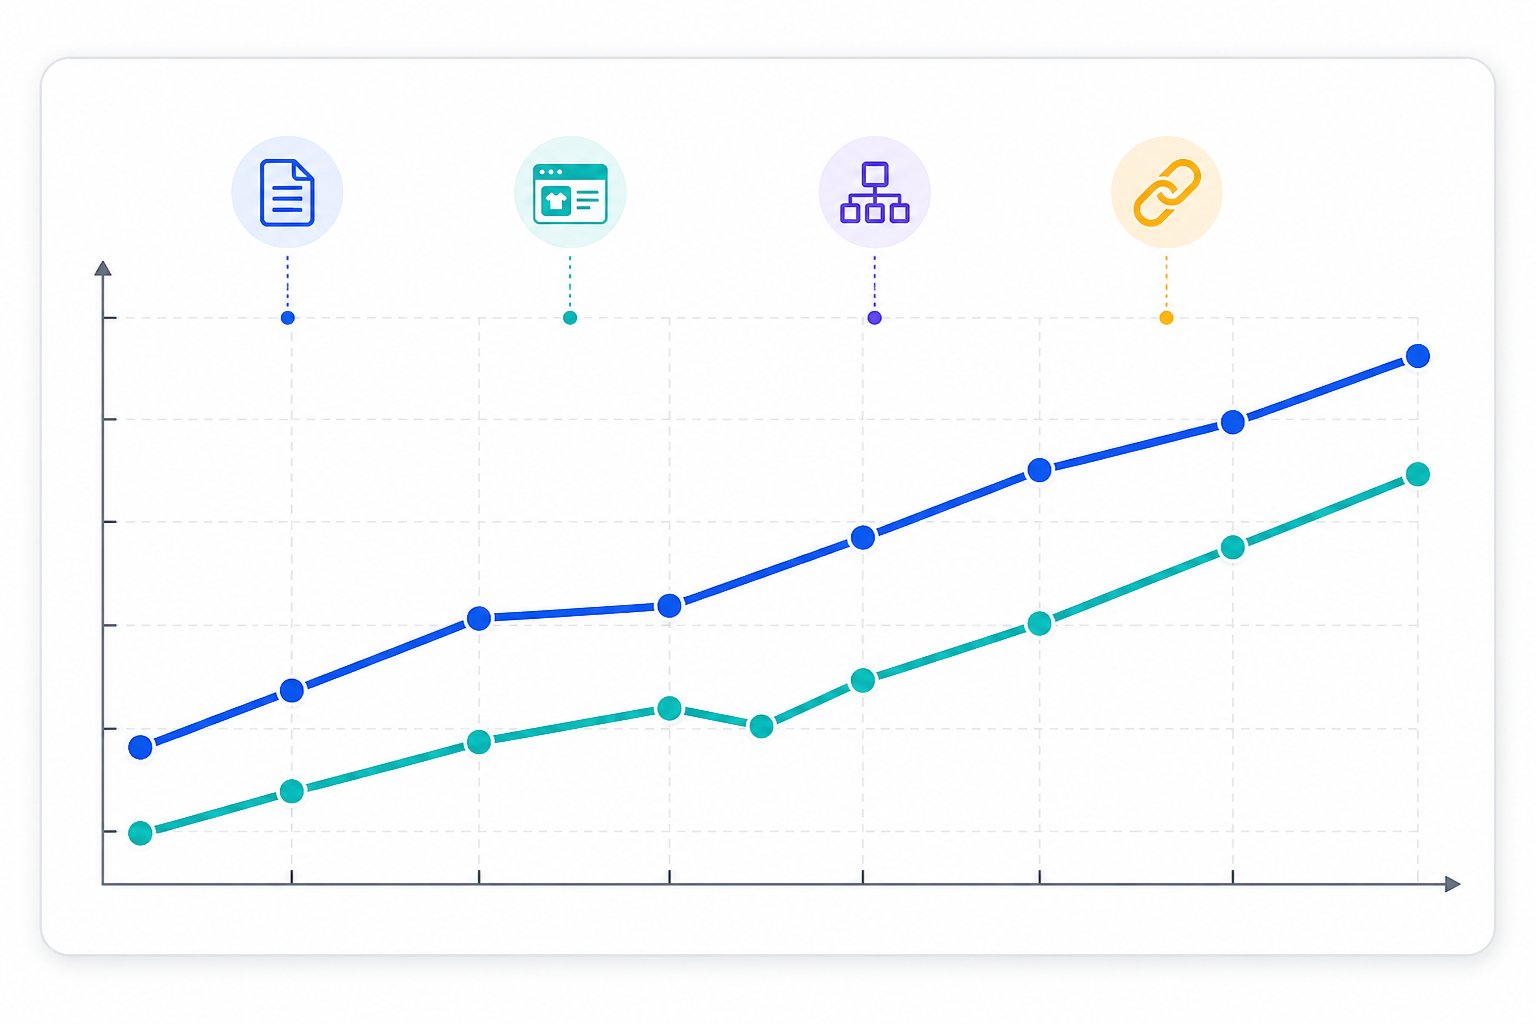
Some tracking tools, including one I work on (MentionOwl), report a single composite visibility score. Ours combines query coverage, position-weighted citations, share of voice and soft mentions into a 0-100 figure. I want to be upfront that this is a proprietary composite, not an industry-standard KPI, and different tools will weight these components differently or not combine them at all.
For example, two brands with an identical 10% citation rate could land on different composite scores if one is cited mostly in top-position answers with strong share of voice, and the other is cited mostly in low-visibility long-tail queries with weak share of voice. If you use a composite score from any provider, ask what it's built from and whether the weighting is disclosed. Don't treat it as interchangeable with the AI citation rate formula above, since they answer different questions.
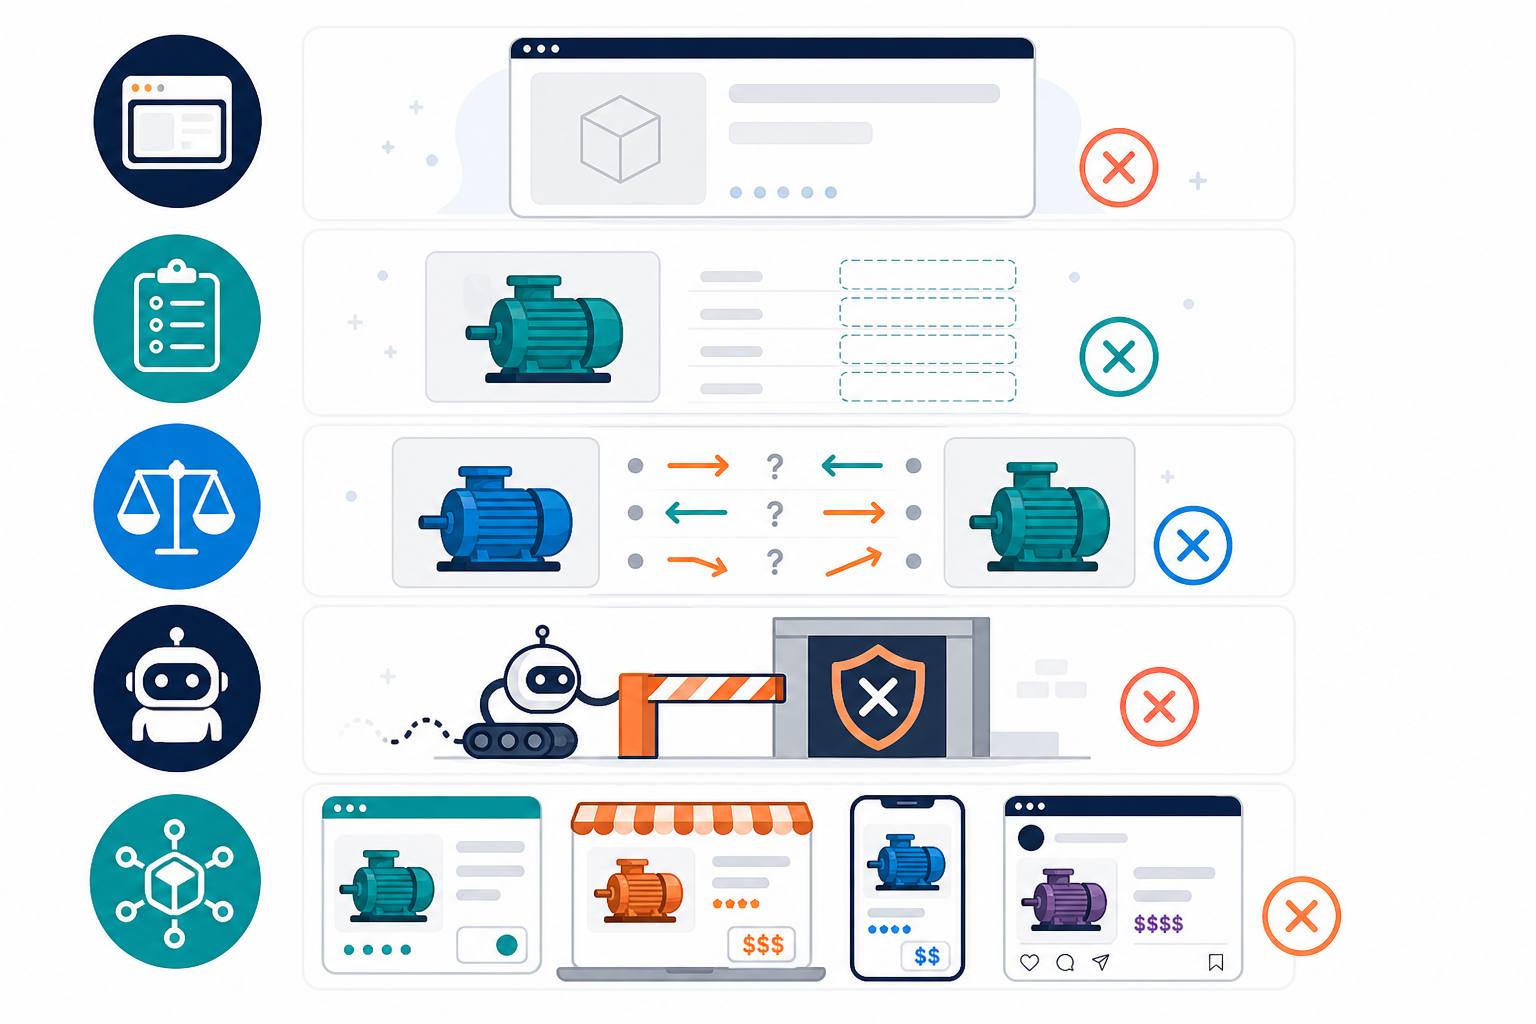
Week one:
Week two:
Week four:
AI citation rate is a measurement framework you build for your own brand, not a single standardised industry KPI against which every e-commerce business is benchmarked.
A mention is any instance where an AI engine references your brand name, even in passing, for example listing you among five options with no elaboration. A citation is stronger: the AI explicitly attributes a claim, recommendation or piece of information to your brand, whether via a visible link or in-text attribution without one ("According to [Brand]'s size guide...").
I treat a third category, where the model appears to draw on your unique content without naming you, as "inferred use". I track it separately rather than folding it into the citation count, since you can't verify it the same way you can a named attribution.
What's visible also varies by platform. Some show explicit source links, others attribute in text only, and personalised or logged-in sessions can return different results from an anonymous query. This is why I always test logged out for consistency.
Choose a realistic set of queries your customers ask when in a buying mindset, such as "best waterproof hiking boots under £150" rather than generic brand searches. Segment them by intent and category rather than treating them as one uniform list.
Run those queries across ChatGPT, Perplexity, Gemini and Copilot on a recurring schedule, using the same location and logged-out state each time. Log whether your brand appears, whether it's cited through a link or named attribution, whether it's just mentioned, and how it compares with named competitors.
Divide cited query-platform runs by total tracked runs and multiply by 100. This is entirely doable in a spreadsheet. Automated tools remove the repetitive checking, not the underlying formula.
Based on patterns I've observed across accounts, not a controlled study, structured comparison content and specification-rich product pages tend to outperform generic marketing copy.
Content with explicit numbers, dimensions, materials, current pricing and honest trade-offs seems to give models more concrete material to attribute. Buying guides that compare multiple named options, FAQs that mirror actual customer phrasing, and pages with clean, machine-readable structured data all correlate with higher citation frequency in what I've reviewed.
However, category and competitive context matter, and I wouldn't claim these findings hold evenly across every vertical.
There's no universal timeline, since no platform publishes its recrawl or retrieval schedule. In the accounts I've tracked, four to eight weeks is a more realistic window for one full test cycle than two, particularly for ChatGPT, which can lag behind Perplexity and Copilot's more live-retrieval-driven behaviour.
I'd frame this as an operational testing window rather than a proven platform recrawl interval. Track weekly with a rolling average rather than daily, since day-to-day fluctuation is normal and easily mistaken for a real signal in either direction.
Discover why AI shopping assistants skip most e-commerce sites. This AI legibility checklist walks UK online retailers through 16 technical checks to

Understand how ChatGPT citations work, where recommendations get their information, and what solo founders can influence to improve AI visibility.

Confused about AI SEO vs traditional SEO? I break down the data on how ChatGPT, Gemini and Perplexity recommend businesses differently from Google, pl