Response Time Reporting: What to Track and Why It Matters
18 min read
Loading...

If you only do one thing with your response time reporting, track three things: first response time, time to resolution, and how both look at the slow end (your 90th percentile), not just the average. Split them by channel and review them weekly. Then add one easy companion: the share of conversations answered within your target. It turns the slow end into a promise your whole team can rally around. Use these customer support metrics to find bottlenecks and coach your team, not to chase a flattering number.
That's the short version. The rest of this post is the coffee-shop version: why those numbers matter, which ones to treat with caution, and how a small team can do useful response time reporting without a data analyst. 😊
Picture a two-person support team. On Monday morning they check their dashboard and see a proud '2-minute average first response'. High fives all round. Then a customer emails to say they waited three days for an answer about a billing error, and another says they've given up chasing a refund.
Both things are true. The average really is two minutes, because most of the team's volume is quick live chats. But the number says nothing about the email that sat untouched over the weekend.
That's the trap. A good report answers one question: are customers feeling looked after? A bad one answers a different question: do we look busy? In this post I'll split metrics into two groups. Diagnostic metrics tend to line up with happy customers. Vanity metrics look good on a slide but tell you little. No metric is a perfect crystal ball, so I'll flag where each one can mislead.
This matters even more once live chat and email share one shared inbox. Customers expect very different speeds from each channel. Someone typing into a live chat widget is waiting right now. Someone sending an email is usually fine with a few hours. Blend those together and you get a number that describes nobody's actual experience.
The good news is you don't need a data team. You need a handful of metrics and a regular habit.
Let's define the two big response time metrics properly.
Customers feel both, in different ways. First response is often where trust starts, because it tells them a real person has seen their message. Resolution is usually where satisfaction is won or lost, because it tells them the problem is gone. A fast 'we're on it' only helps if the fix follows. Otherwise you've just sped up the moment they start feeling ignored.
There's plenty of evidence that people care about speed up front. HubSpot's 2022 State of Customer Service report found that 90% of consumers surveyed said an immediate response was important or very important when they had a customer service question. Zendesk's 2023 CX Trends research reported that 72% of customers expect immediate service. (Exact wording and survey populations vary, so check the original reports before quoting them.) Treat these as context. They show that people care about speed. They don't tell you what the right target is for your team, and they don't prove that faster first replies make customers happier on their own.
Here's a common way first response numbers get quietly inflated: automatic acknowledgements. If your customer support software counts 'Thanks, we've received your message!' as a first response, your average will look wonderful and mean almost nothing. I'd recommend excluding auto-replies and bot greetings from your reporting. It's also worth checking how your tool treats pauses and reopened conversations, so the numbers match what customers actually experience.
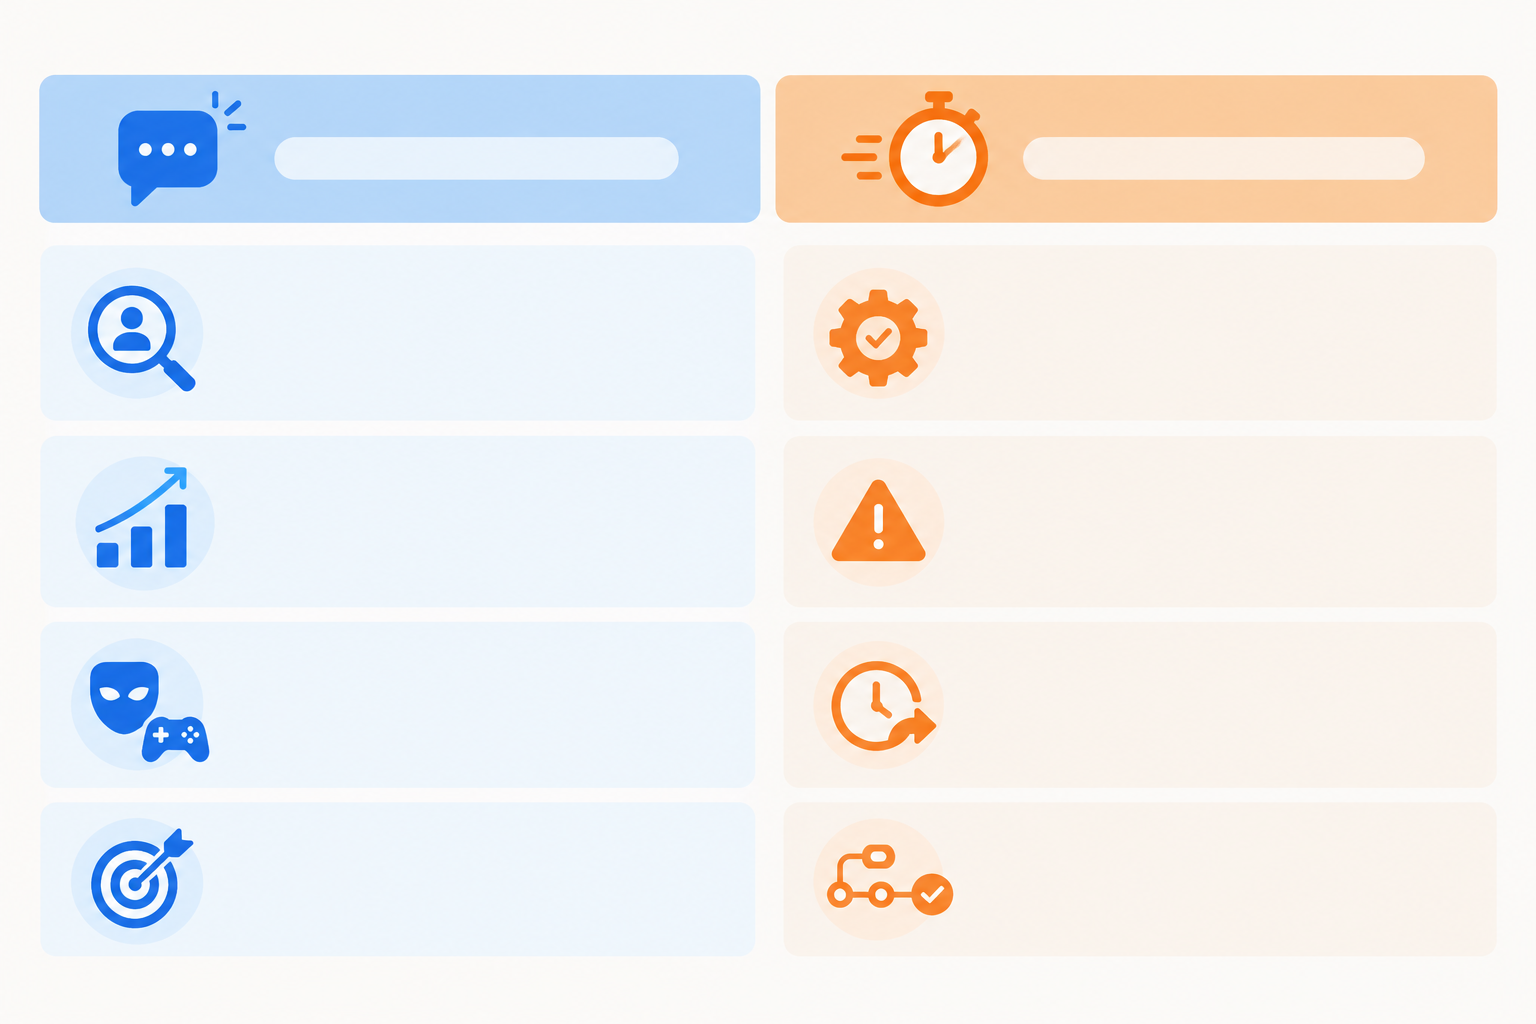
| First response time | Time to resolution | |
|---|---|---|
| What it measures | How long until a human replies | How long until the issue is actually solved |
| What it can indicate | Whether customers feel heard (a useful signal, not a guarantee) | Whether problems are really getting fixed, which often shapes satisfaction |
| How it can be gamed | Quick 'looking into it' replies, or counting auto-replies | Closing conversations early, then watching them reopen |
| Best used for | Spotting staffing gaps and neglected channels | Spotting complex topics, handoffs and knowledge gaps |
| Typical unit | Seconds/minutes (chat), hours (email) | Hours to days, depending on the issue |
I've left specific targets out of the table on purpose. Set your own based on your baseline (more on that shortly).
Live chat is best measured in seconds and minutes. Email is naturally measured in hours. Blend them into one figure and chat will drag the number down and hide email delays, which is exactly what happened to our two-person team above.
This one catches out a lot of UK teams. If you work standard hours, an email arriving at 6pm on a Friday will 'wait' 63 hours before you're back at 9am on Monday. Measured in calendar hours, that looks terrible. Measured in business hours, it looks fine. Neither is wrong, but pick one, apply it consistently, and be clear about it with customers. Many teams report business hours internally and promise them to customers too, such as 'within four working hours'.
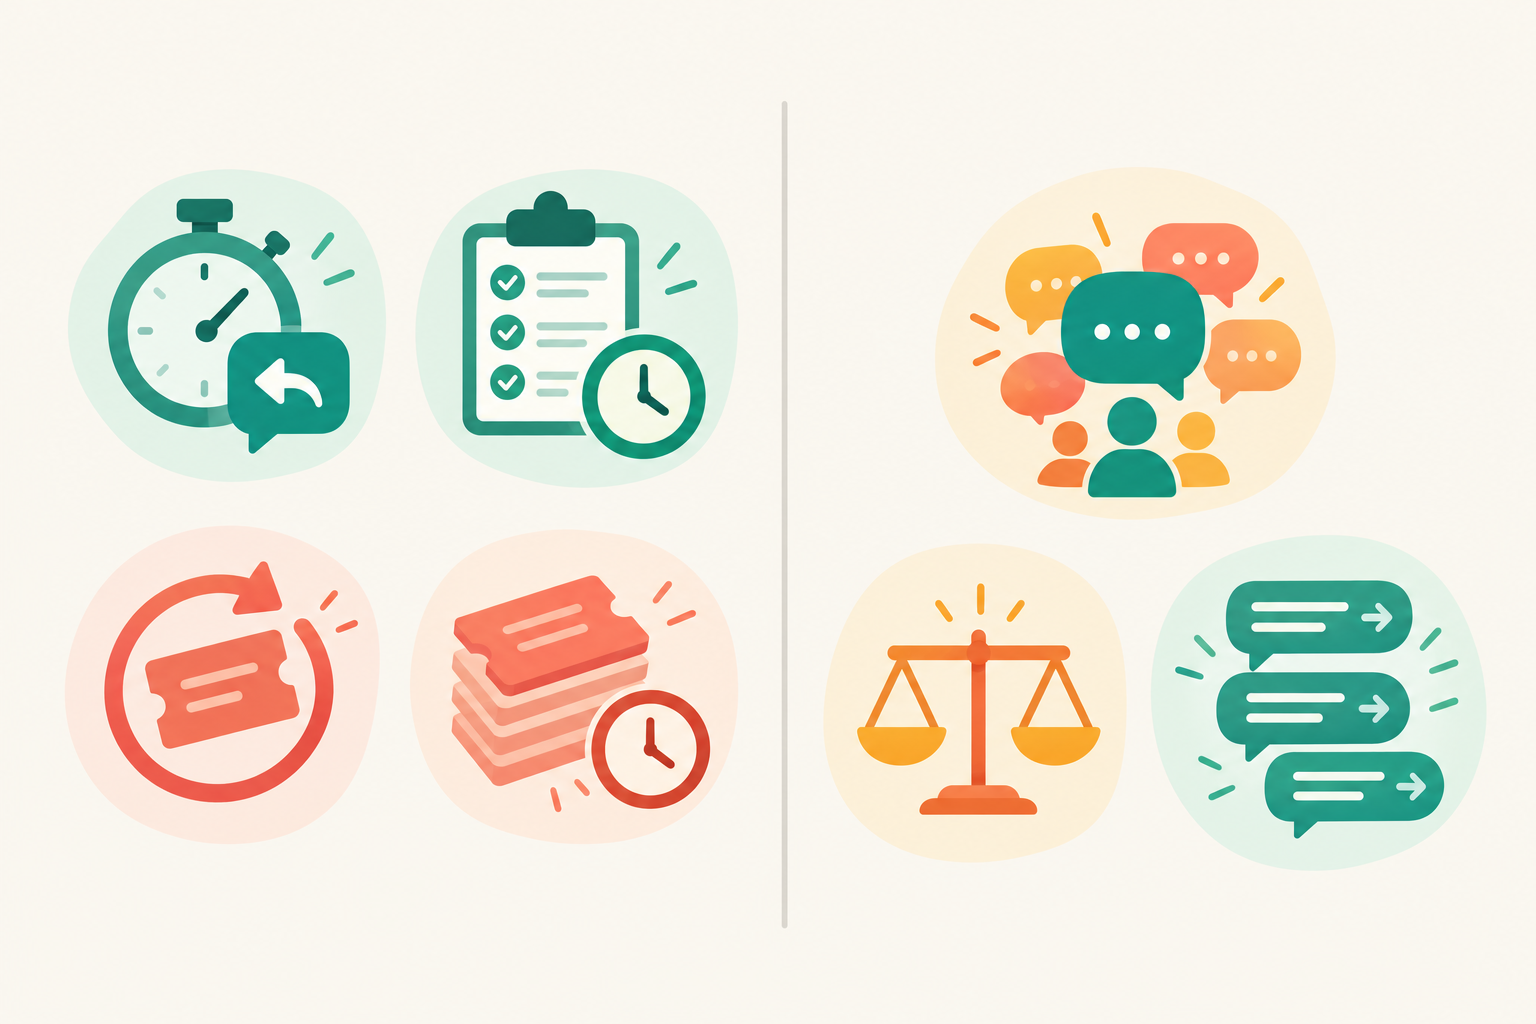
A useful test for any metric is whether you can tie it to a customer feeling. Here's how I'd sort them. The first three are your core set, and the rest play supporting roles.
Zendesk's CX Trends research adds a related point: around 70% of customers surveyed expect anyone they speak to to have the full context of their situation. A quick reply that makes the customer repeat everything isn't a win, so repeat contacts are worth watching.
Where you can, pair these numbers with satisfaction ratings, even a simple thumbs up or down. That lets you check which of your metrics line up with happy customers in your business. Speed alone can reward rushed replies and premature closures, so a speed metric should always sit next to an outcome metric like satisfaction or reopen rate.
Let's work through a quick example, because this is the part that surprises people.
Imagine ten customers. Nine chat with you and get a reply in one minute. The tenth sends an email and waits 30 hours (1,800 minutes). Add it all up and divide by ten, and your average is roughly three hours.
Three hours! That number describes nobody. Nine people were delighted and one waited well over a day. The average smooths everything into something that sounds mildly acceptable, and the unhappy customer vanishes into it.
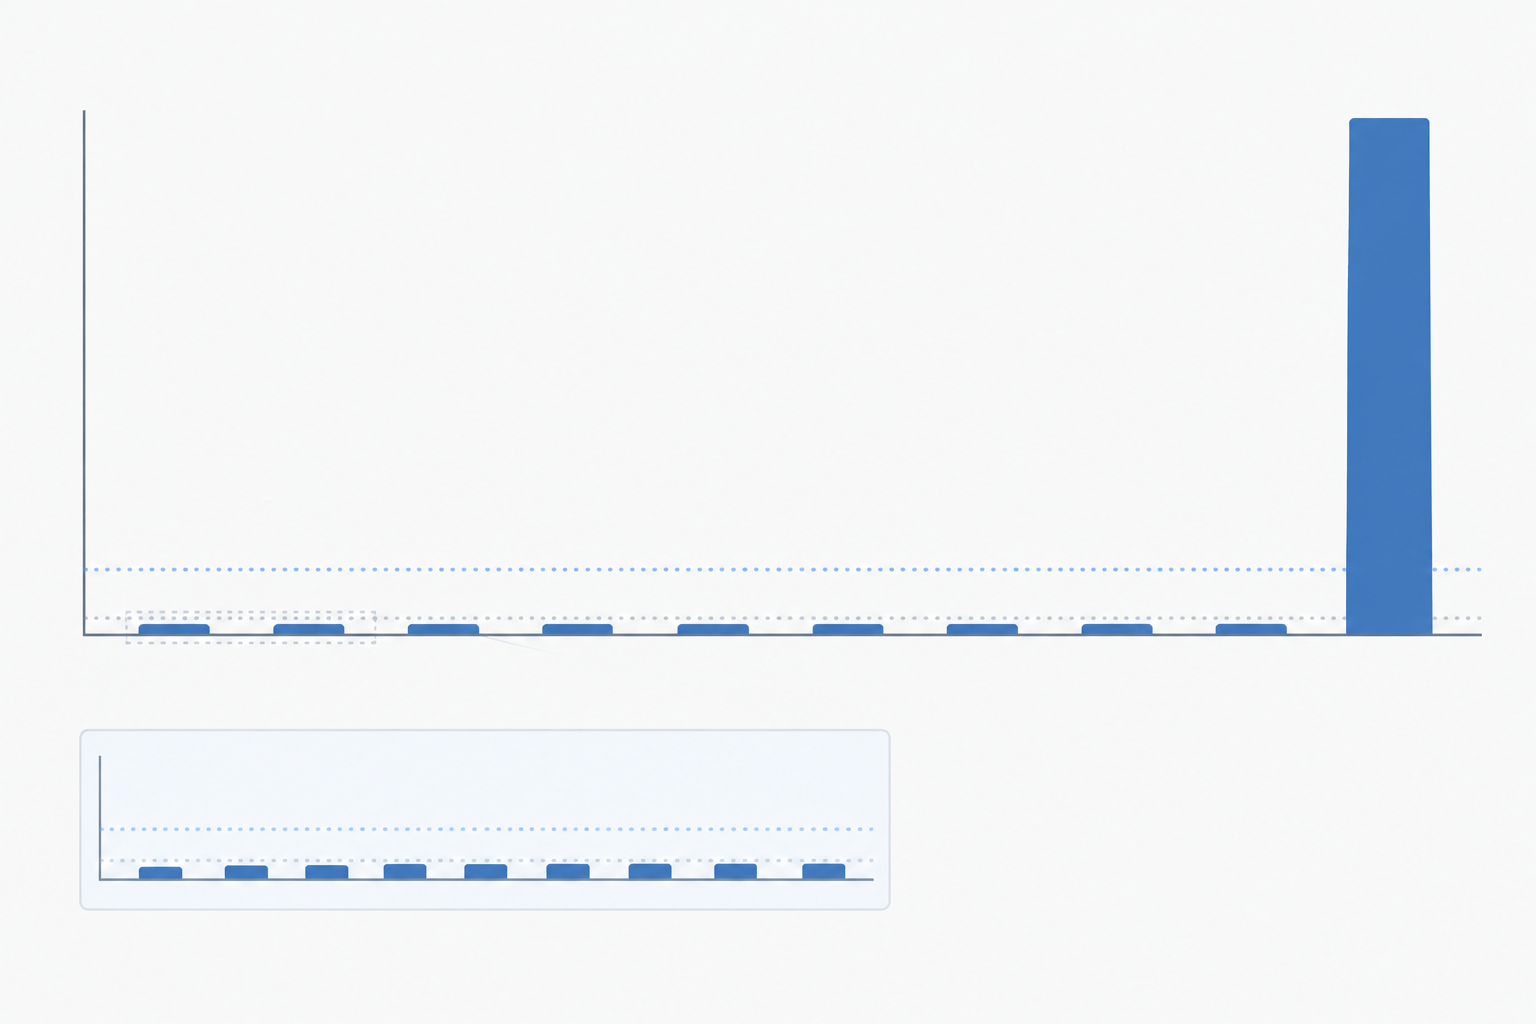
Two simple ideas rescue you here:
A word of caution, though. With only ten conversations, the 90th percentile is shaky. Depending on how your tool calculates it, our example could land anywhere from one minute to the full 30 hours, because a single conversation decides the answer. That's why I haven't drawn a 90th percentile line on the chart above. Percentiles become useful once you have a few weeks of data and a reasonable volume of conversations. It's also worth checking how your reporting tool calculates them, so you compare like with like over time.
When you do have enough data, look at all three together: average, median and 90th percentile. If the average improves but the 90th percentile gets worse, you may have a growing group of people waiting too long while quick chats flatter the overall picture.
A few usual suspects pull averages around:
The most practical question you can ask is: what percentage of customers waited longer than we promised? That single figure is hard to hide behind. Most help desk software lets you filter by channel, tag and time period, so you can see beyond one blended number without building a spreadsheet.
It's tempting to Google 'good email response time', copy the first number and call it a target. Please don't. Published figures vary widely, depend on who was surveyed and when, and are best treated as rough guides. (If you do quote any, double-check the source and date first.)
Here's a calmer way to do it.
One more thing: tell your customers. Put your target on your contact page or in your auto-reply, such as 'We usually reply within four working hours'. It sets expectations, reduces chasing emails, and gives your team a public standard to live up to. Just remember that the auto-reply itself shouldn't count as your first response in the reports!
Once you have a baseline, the reports become a detective tool. Here's where I'd look first.
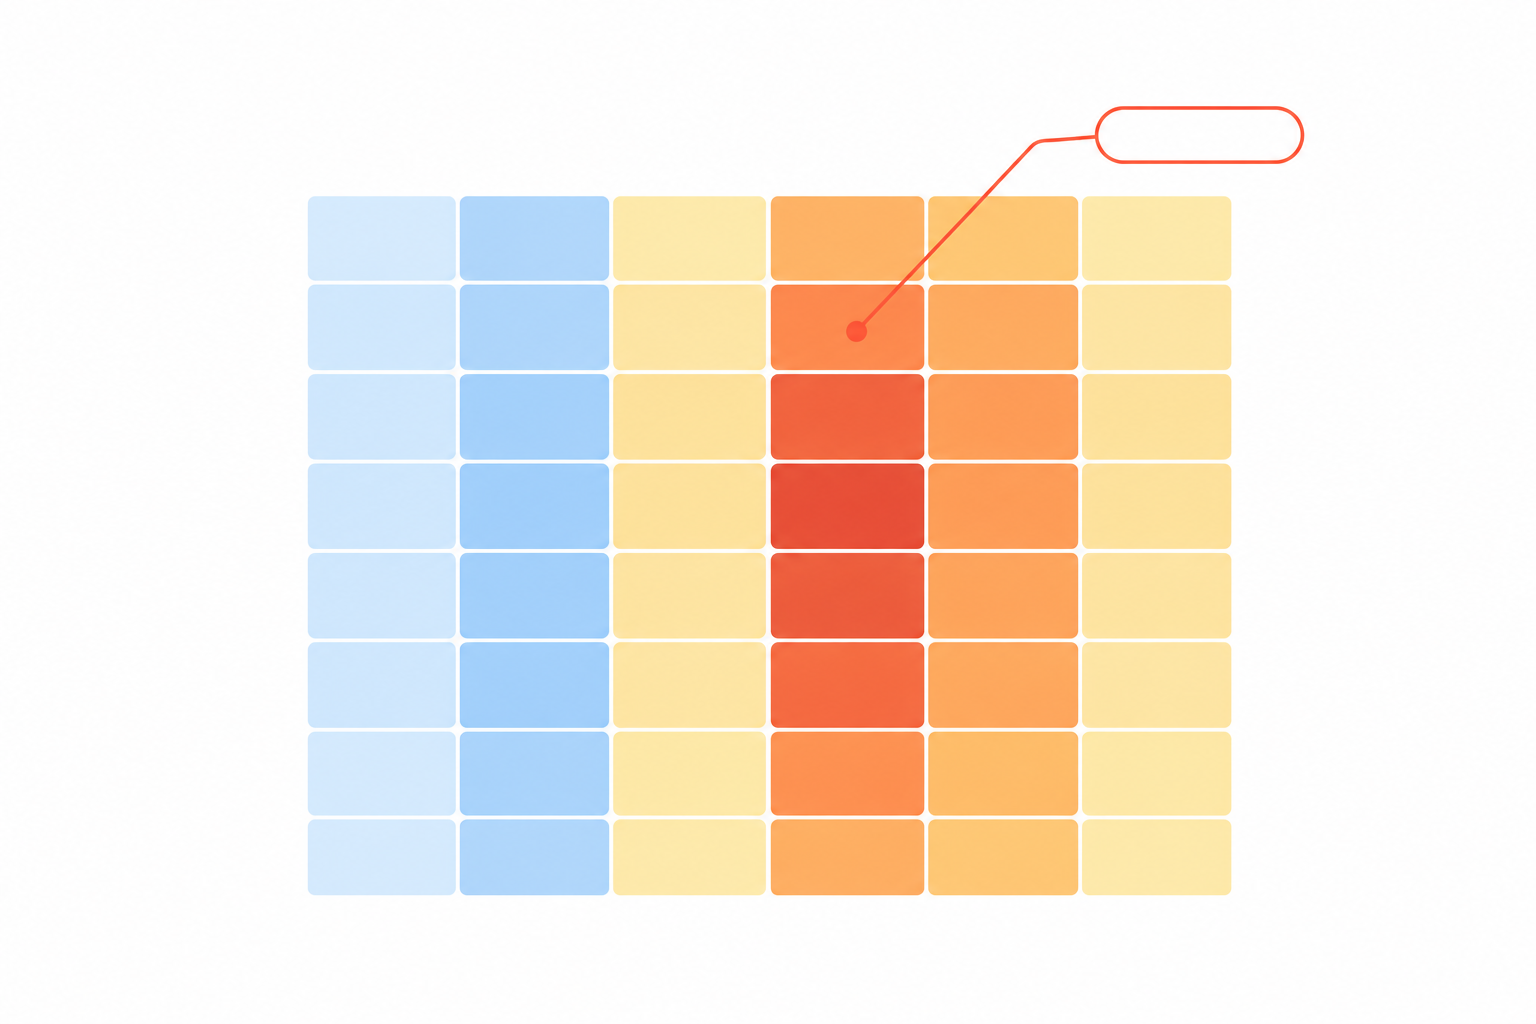
When the same topic shows up as slow again and again, 'work faster' is rarely the right fix. More often there's a missing help article, a canned reply that would save ten minutes each time, or a simple tag-and-route rule that gets the right person involved sooner.
This is the bit I care about most. Reports are a conversation starter, not a scoreboard. If your team feels watched, they'll game the numbers by closing conversations early, sending quick 'looking into it' replies, or avoiding tricky tickets. Nobody wins.
Try opening with curiosity. Something like: 'I noticed billing questions take longer than most. What's getting in the way?' You might hear that the refund process needs three approvals, or that nobody's sure about the VAT rules. Suddenly you've found a process fix instead of a performance problem.
Reports can also point to training needs. One agent with lots of reopens on a specific topic might need a quick walkthrough of it. A knowledge gap across the whole team probably means a missing doc, not a missing skill. Both are useful, and neither calls for blame.
A few habits that help:
Little and often beats big and rare. Here's a rhythm that works for small teams:
Keep it light. One shared dashboard beats five spreadsheets, because the best report is the one people actually open.
Here's the unglamorous truth: accurate reporting is nearly impossible when your tools are scattered. If chat lives in one app and email in another, you're stitching numbers together by hand. Different tools also measure things differently, so you end up comparing apples with slightly different apples.
A shared inbox with live chat and email in one place gives you comparable data across channels: the same clock, the same definitions, one view. That's what good customer support software should do for you.
One example is Sonny, which brings live chat, email-to-ticket forwarding, internal notes, tagging and filtering together, with reporting on response times and team performance. It costs a flat $19.99 a month in US dollars (so the sterling amount will depend on the exchange rate) with unlimited agents, and there's a free trial. Check sonny.com for current plans before you decide. Whatever tool you choose, make sure it lets you filter by channel and shows more than a single blended average.
Your next step: pick three metrics (first response time by channel, time to resolution, and the slow end of both), grab a baseline this week, and add the share answered within target as your team-friendly goal. Then review it together on Friday. Don't aim to fix anything yet. Just look. 💛
Start with first response time (excluding auto-replies), time to resolution, and the slow end of both (the 90th percentile), all split by channel. The share of conversations answered within your target is a handy companion that makes the slow end easier to talk about. Add reopen rate and backlog age once those feel comfortable.
Do a quick daily check on your oldest unanswered conversations and a short weekly review of response, resolution and the slow end. Then take a deeper monthly look at patterns by topic and time. Reset your benchmarks every quarter, or whenever your team or volume changes significantly.
Yes. If certain topics take longer, get reopened more often or involve lots of back-and-forth, that can point to a knowledge gap or a missing resource. Treat it as a prompt for a supportive conversation and a chance to improve docs or canned replies, not as a way to blame individuals.
It isn't bad, just incomplete. Averages hide the customers who waited far too long. Pair them with the median, the 90th percentile and the share of replies that met your target to get a truer picture.
No. Customers expect live chat replies in minutes and are generally comfortable with email replies in hours. Set separate targets for each channel and report on them separately.

Get new support agents ready to help in an hour with simple roles, saved replies, shadowing and team collaboration habits that keep startup customers

Thinking about handing over customer support? Learn when to make your first support hire, what to look for, and how the right help desk software lets

Learn how internal notes in a shared inbox keep context on tricky tickets, speed up handoffs and replace scattered Slack threads and spreadsheets for