Share of Voice in AI Answers: How Marketing Teams Should Measure and Report It
20 min read
Loading...

Meta description: Learn how UK marketing teams can measure AI share of voice across ChatGPT, Gemini and Perplexity, with a worked calculation, leadership reporting template and practical FAQs.
Share of voice in AI answers measures how often your brand is mentioned, cited or recommended by generative engines such as ChatGPT, Gemini and Perplexity, relative to your competitors, across the questions your buyers actually ask. Unlike traditional share of voice, which relies on impression counts, ad spend or media mentions, AI share of voice depends on query coverage, citation position and sentiment across a rotating set of AI-generated answers that can change from one week to the next.
One limitation up front, because it shapes everything that follows: this is a directional AI visibility metric. It tells you whether you are showing up in the conversation, not whether that visibility is converting into traffic, pipeline or revenue. I treat it as a leading indicator tracked alongside those numbers, never as a replacement for them, and I will return to that distinction throughout.
Below, I will explain how AI share of voice is calculated, including where my methodology is a working framework rather than an industry standard. I will also cover why it deserves a place in a marketing dashboard, how LLM monitoring supports it and how to report the results to leadership using a template you can copy.
Traditional share of voice was built for a world of static channels. You would count ad spend against category totals, tally media mentions across trade press or track average search ranking positions across a fixed keyword list. All of these approaches share a common assumption: visibility is a snapshot you can capture once and trust for weeks or months at a time.
AI search breaks that assumption. The clearest academic anchor for this is the 2024 "GEO: Generative Engine Optimization" paper — a study from Princeton, Georgia Tech, the Allen Institute for AI and IIT Delhi, presented at KDD 2024 — which examined how content sources are selected and cited within generative answers. I want to be precise about what that paper does and does not establish: it proposes methods for making content more visible to generative engines, but it does not provide the industry with a single, universally agreed AI share-of-voice standard. No such standard exists yet.
That is why I label the framework below as a working methodology rather than settled convention. Any team building an AI visibility measurement programme should keep that distinction in mind.
What is established versus what is still experimental, as I read the evidence: it is established that generative answers can compress awareness, consideration and comparison into a single block of text, and that citation behaviour differs meaningfully between engines. It is still experimental — meaning it is my working practice, not a peer-reviewed standard — how any given event should be weighted commercially and whether sentiment should be treated as a modifier or a separate metric.
A single generated response can recommend a product, compare it against two competitors and implicitly rank all three in one paragraph. This collapses what used to be three separate funnel stages into one block of text that either includes you prominently or does not include you at all.
Before going further, here is the taxonomy of events I use, because “mention” is used loosely in this space and that creates real reporting problems:
This compression, and the taxonomy above, are why AI SOV needs to be measured per engine rather than as one universal figure. ChatGPT, Claude, Gemini, Copilot and Perplexity each draw on different training data and retrieval sources, and each shows distinct citation habits. A brand that dominates Perplexity’s citation-heavy answers might be nearly invisible in a Copilot response that draws from a narrower set of indexed sources.
I capture the exact prompt, date, market, language, model, answer text, cited sources, brand mentions, competitors, sentiment and answer position for every tracked query. I will be upfront that this is the schema we use at MentionOwl, where I work. It is one workable practice, not a rule imposed by any search provider, and you should adapt it to your needs.
Blending engines into a single number without disclosing the underlying spread hides precisely the kind of platform-specific weakness a marketing team needs to act on. A blended average can still earn a place in a top-line executive view, but it should never be presented as though the differences between platforms have disappeared.
There is a UK dimension worth separating clearly from the global picture, because the two are often conflated. Google’s AI Overviews expanded from an initial US rollout into additional English-speaking markets, including the UK, during 2024. Google’s own product updates state that the feature had reached more than 200 countries and over 40 languages by mid-2025.
Separately, Pew Research Center’s 2025 analysis of US Google search behaviour found that when an AI-generated summary appeared on a results page, users clicked through to a traditional organic result in roughly 8% of visits, compared with roughly 15% when no summary appeared. Users clicked a link inside the summary itself in only about 1% of cases.
I am citing that as US evidence of a behavioural pattern worth watching, not as proof of UK click-through rates. No equivalent UK-specific study is cited here, so I would treat the two markets as directionally related rather than identical until UK-specific data exists. What the research supports, cautiously, is that UK marketing teams comparing SaaS tools, insurance products or similar considered purchases should expect a growing share of research to happen inside the answer itself rather than in the ten blue links beneath it.
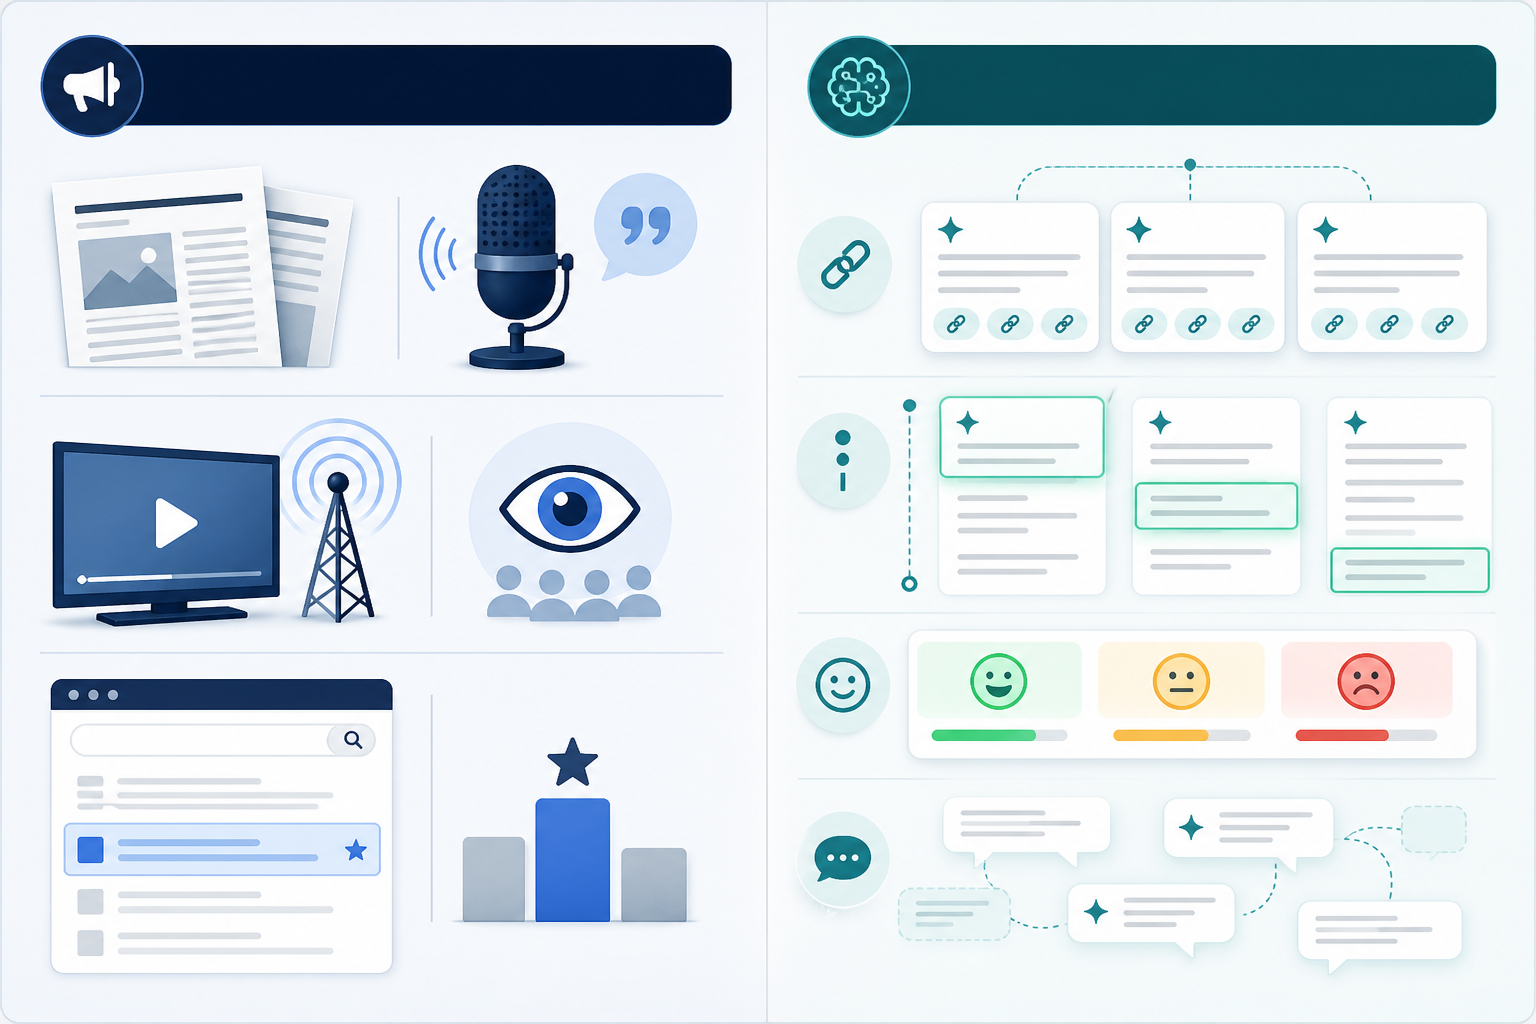
Before the formula, three definitions underpin the rest of this section. Skipping them is where much AI SOV reporting goes wrong:
Here is the six-step process I use to keep mentions, citations and sentiment separate rather than blurring them into one soft number.
The formula, stated plainly:
AI SOV (%) = (Σ highest-weighted brand event per answer, summed across tracked prompts) ÷ (Σ same, summed across all tracked brands) × 100
Here is a worked, illustrative example. The numbers demonstrate the mechanics rather than coming from a live client report. It covers a UK SaaS brand tracked across 100 prompts on three engines against two named competitors:
| Brand | First-position recommendations (×1.0) | Secondary/comparative mentions (×0.6) | Citations counted separately (informational) | Weighted core score | Soft mentions (reported separately) | Query coverage (any primary event) |
|---|---|---|---|---|---|---|
| Brand A (ours) | 18 | 15 | 34 | 27.0 | 9 | 33% |
| Competitor B | 30 | 21 | 41 | 42.6 | 6 | 51% |
| Competitor C | 12 | 21 | 22 | 24.6 | 4 | 33% |
| Total | 94.2 |
Brand A’s weighted AI SOV = 27.0 ÷ 94.2 × 100 = 28.7%, against Competitor B’s 45.2% and Competitor C’s 26.1%.
The query coverage column tells a slightly different story worth reporting alongside it: Brand A and Competitor C appear in the same share of answers overall, at 33%, but Competitor B pulls ahead specifically through first-position recommendations rather than broader coverage. That is a more precise diagnosis than a single blended figure. It says the gap is concentrated in prominence, not presence, which points to a different fix: stronger comparison content, rather than more content generally.
| Reason | What it lets you decide | Limitation | Action it supports |
|---|---|---|---|
| Buyer research is shifting into the answer itself | Whether your existing organic-rank dashboard still reflects where research happens | US click-through data from Pew is not confirmed as UK-equivalent | Add AI SOV as a parallel line, not a replacement, for organic rank |
| Competitive movement in AI answers can be fast and invisible | Whether a competitor’s citation gain is new or long-standing | Requires a tracked series; a single snapshot cannot show movement | Set a weekly, or daily for volatile categories, tracking cadence |
| SOV drops often trace to one specific content asset | Whether a competitor’s rise in first-position recommendations links to a comparison page, pricing breakdown or review roundup | Correlation between a cited asset and rising SOV is not the same as proven causation | Audit the cited asset directly and brief content teams on the specific gap |
| Query coverage and prominence can move independently | Whether you have a visibility problem or a positioning problem | Neither metric alone tells you which; report both | Prioritise content that competes for first-position recommendations, not just presence |
📊 Pro tip: Resist reporting a single blended number without its components. A leadership team shown “28.7% SOV” with no breakdown will ask one question — “is that good?” — and you will not have an answer unless you can show engine-level detail, query coverage and the trend line behind it.
Executives do not need the six-step methodology. They need a narrative they can act on in under two minutes, backed by a table they can question. Here is the template I use, designed to be copied directly into a slide or one-pager.
Slide narrative — five fixed elements:
Supporting table for the appendix or backup slide:
| Metric | This period | Prior period | Change | Notes |
|---|---|---|---|---|
| Weighted AI SOV | 28.7% | 25.5% | +3.2 pts | Blended across three engines |
| Query coverage | 33% | 30% | +3 pts | Percentage of prompts with any primary event |
| First-position recommendation rate | 18% | 14% | +4 pts | Strongest driver of the gap versus the leader |
| Sentiment — positive share | 71% | 68% | +3 pts | Reported separately, never multiplied into SOV |
| Sample size / cadence | 100 prompts, weekly | — | — | UK market, English UK, three engines, model versions logged |
One anonymised example, because a number alone rarely convinces a room: in response to the prompt “best [category] tool for a 20-person UK team”, one tracked answer opened with “For a growing UK team, [Competitor B] is typically the strongest fit, offering…” before naming our brand two sentences later as a secondary option “worth considering for teams prioritising [specific feature].”
That is a first-position recommendation for the competitor and a secondary mention (×0.6) for us in the same answer. It is exactly the kind of granular evidence that a blended percentage alone cannot convey, and why I keep verbatim examples in the appendix of every leadership report.
What I explicitly avoid on the main slide is any claim that AI SOV predicts future market share or revenue. It does not, at least not on evidence I would be comfortable defending under questioning. It is a visibility metric that correlates with top-of-funnel attention. Treat it with the same caution you would apply to impression share in paid media: useful for diagnosing where attention is going, but not sufficient on its own to justify budget reallocation without corroborating pipeline data.
Improving AI SOV is not a single technical fix. I would be cautious of anyone suggesting your site simply is not being “read” by AI crawlers and that patching one setting will solve it. In practice, several factors interact, and it is worth being honest about which are well understood and which remain emerging practice.
The realistic expectation is gradual, engine-by-engine improvement measured over a quarter, not a single dramatic jump after one content push.
Traditional share of voice counts fixed, countable events — ad impressions, media mentions or search rank on a static results page — captured at a point in time. AI share of voice tracks a rotating set of generated answers that change over time, measures citation position and sentiment rather than just presence, and compresses what used to be separate funnel stages into a single block of text. It requires ongoing, per-engine tracking with a defined competitor set and denominator, rather than a periodic audit.
I separate this into four categories: a direct mention, where your brand is named in the answer text; a citation, where your domain is listed as a source; a recommendation, where you are explicitly named as the answer to a buying question; and a soft or inferred mention, where your brand is implied but not named. Only the first three feed a primary AI SOV score. Soft mentions carry attribution risk and belong in a separate, clearly labelled metric.
Use a fixed five-part narrative: current position, recent movement, the leading competitor and why they are leading, the specific cause and a recommended action. Support it with a table showing coverage, sentiment, sample size and cadence. Avoid presenting a single blended number without an engine-level breakdown, and be explicit that this is a visibility metric rather than a revenue forecast.
Not on the evidence available to me. AI SOV correlates with top-of-funnel visibility and can flag competitive shifts early, but I have not seen it validated — by controlled study or consistent before-and-after examples — as a predictor of market share or revenue outcomes. Treat any claim otherwise with scepticism, and track AI SOV alongside traffic, pipeline and conversion data rather than in place of them.
AI share of voice deserves a permanent line in your reporting, but only if it is built on a transparent methodology: a defined unit of analysis and denominator, mentions separated from citations and soft inferences, weighting labelled as illustrative rather than validated, sentiment kept as its own metric and per-engine detail reported alongside any blended average.
If you are starting from nothing, use this first-month checklist:
Do that, and you will have a share-of-voice metric that leadership can act on rather than dismiss.
Target keywords: share of voice, AI visibility, LLM monitoring, brand monitoring

Mention counts tell leadership nothing about brand perception. Learn how sentiment analysis across ChatGPT, Gemini, and Perplexity reveals whether AI

A real-world case study on AI visibility decline: how a UK small business lost customers to a competitor in ChatGPT and Gemini answers—and the data th

A plain-language breakdown of the AI visibility score—query coverage, position-weighted citations, and share of voice—so founders know exactly what to