Turning AI Visibility Data Into a Winning QBR Presentation: A Marketing Team's Guide

How to turn AI visibility and share of voice into a leadership-ready QBR
The most effective QBR presentations translate raw AI visibility numbers (your MentionOwl score, share of voice, citation frequency) into three things executives actually care about: competitive position, revenue risk or opportunity, and a clear plan for next quarter. I've sat through enough leadership reviews to know that a slide full of percentages means nothing unless it answers the question every executive is silently asking: "So what does this mean for us commercially?" Below, I'll walk through which metrics to pull, how to frame them as business impact rather than vanity stats, and how to benchmark against competitors without drowning your deck in noise.
Why leadership now cares about AI visibility and brand monitoring
It's worth pausing on why this topic has landed on the QBR agenda at all, because the shift has happened quickly and for reasons that aren't always obvious from inside a marketing team. Gartner forecasts that traditional search engine volume will decrease by 25% by 2026 as a direct result of AI chatbots and virtual agents absorbing queries that once went to Google. That's a forecast rather than a measured historical decline, but it's serious enough that boards are asking marketing leaders to account for it now rather than waiting for confirmation.
The underlying behaviour driving this is straightforward. Pew Research Center found that 23% of US adults had used ChatGPT as of February 2024, rising to 43% among adults aged 18 to 29, a cohort that skews heavily toward early-career purchase decision-makers. McKinsey's 2024 State of AI research reported that 65% of organisations now regularly use generative AI in at least one business function, nearly double the share from the previous survey cycle. Put those together and you get a buyer population that increasingly asks ChatGPT, Perplexity, or Gemini for a recommendation before ever opening a browser tab to visit a company website. That means a brand can lose a sale before a single click happens, and no amount of on-site conversion rate optimisation will recover a prospect who never arrives.
I've noticed UK leadership teams specifically starting to ask a very particular question in reviews: "are we being recommended?" That's a different question from "where do we rank" or "what's our cost per click," and it requires a different kind of evidence. Call it brand monitoring, but for a layer of the internet that didn't really exist in its current form three years ago.
It's important to position this correctly in your own reporting structure. AI visibility monitoring isn't a replacement for your existing SEO or paid media reporting; it's a new, necessary category sitting alongside them. Adobe Analytics documented more than 1,000% year-over-year growth in generative-AI-referred traffic to US retail sites during 2024. That traffic remains small in absolute terms compared to organic and paid channels, but the growth rate is the kind of number that gets a CFO's attention, and it signals an acquisition channel that deserves its own line in the quarterly narrative rather than being folded invisibly into "organic."
There's a risk side to this too, not just an opportunity one. When Air Canada's chatbot gave a customer incorrect information about bereavement fares, a Canadian tribunal held the airline liable, establishing that customers treat AI-generated brand answers as official company representations, errors included. That's worth a brief mention in your QBR: AI visibility monitoring covers more than winning share of voice. It also means catching factual inaccuracies before they become liability.
Which AI visibility and share of voice metrics to include in your QBR deck
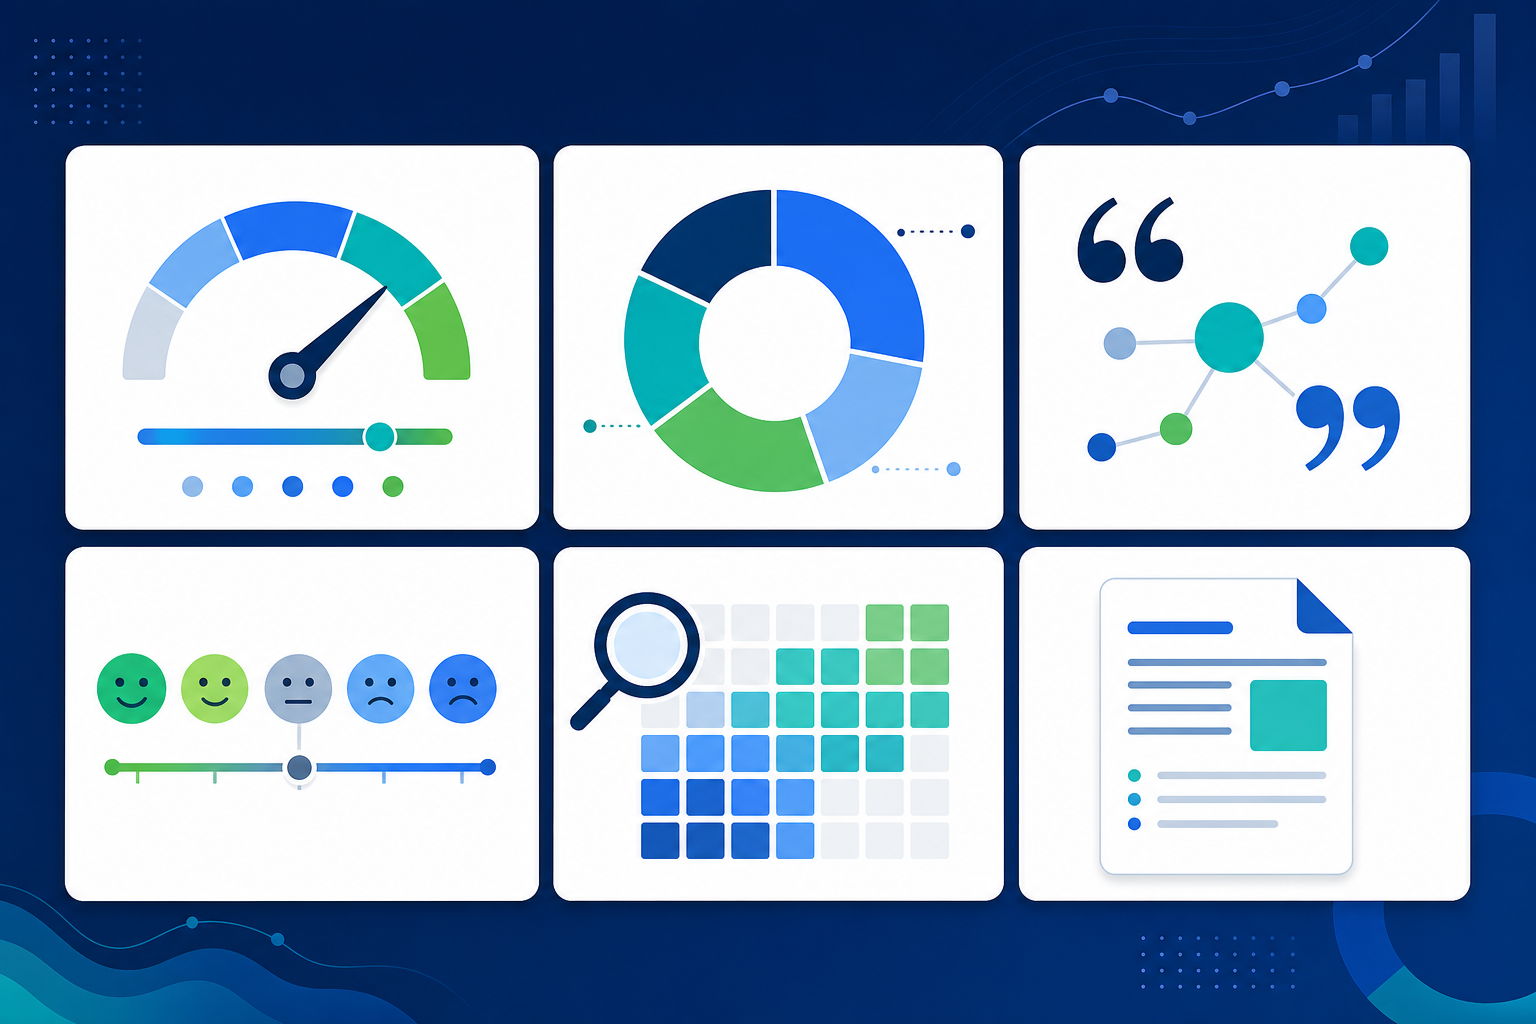
One mistake I see marketing teams make constantly is trying to show leadership everything a platform like MentionOwl tracks. Resist that urge. Decks that attempt comprehensive coverage end up diluting the one or two numbers that actually move the conversation forward. I'd cap the core metrics at five or six:
- Visibility score trend: your MentionOwl 0-100 score plotted across the quarter, not just a single snapshot. Trajectory matters more than any individual reading, since AI-generated answers are probabilistic and can shift across models, sessions, and dates.
- Share of voice versus named competitors: the percentage of relevant queries where your brand appears relative to your tracked competitor set.
- Citation frequency and position-weighted citations: how often and how prominently you're cited across ChatGPT, Claude, Gemini, Copilot, and Perplexity specifically, since position within an answer matters as much as raw mention count.
- Sentiment breakdown: how AI engines characterise your brand versus competitors when they do mention you.
- Query coverage: the percentage of relevant customer questions that surface your brand at all, which often reveals gaps hiding behind a healthy-looking overall score.
- AI legibility audit score: technical visibility issues frequently explain gaps before competitive ones do, and this is the metric most within your immediate control to fix.
A note on tracking depth: a single overall visibility score can conceal meaningful differences between branded queries, nonbranded category queries, and comparison-style prompts such as "best CRM for mid-market companies." I'd keep that granularity in your working data even if you only present the top-line number in the QBR itself. Leadership rarely needs the full breakdown, but you'll want it ready if someone asks a follow-up question.
How to turn AI visibility scores into business impact stories
Numbers alone don't persuade a room. Context does. Here's the sequence I use to convert AI visibility data into something leadership actually retains:
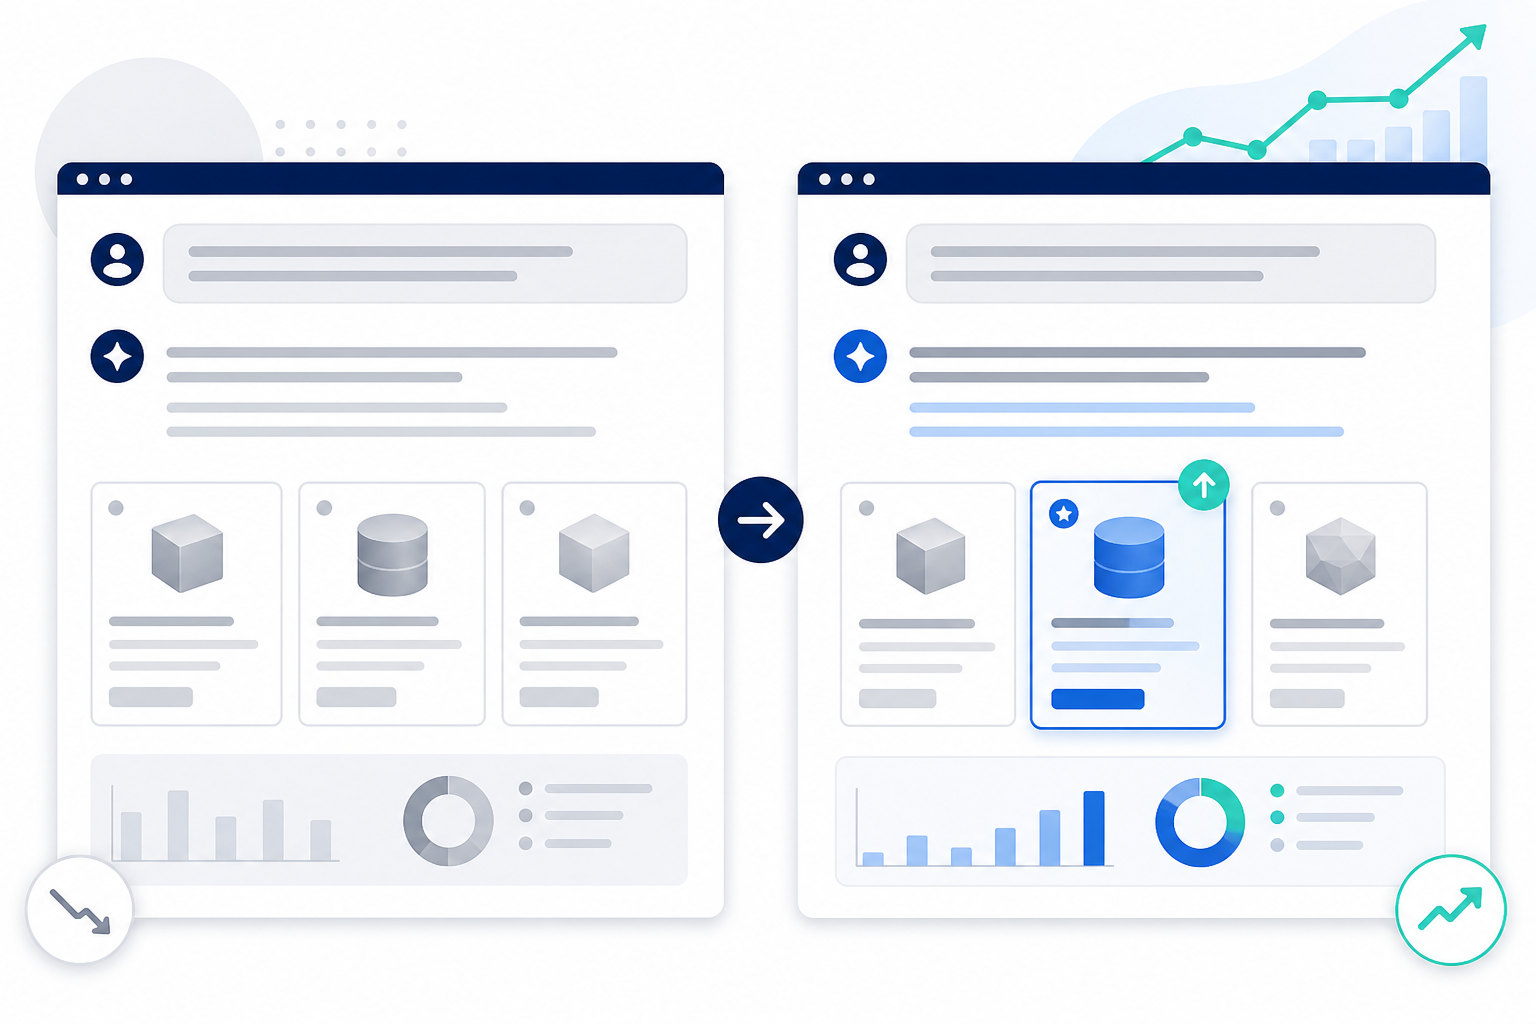
Start with the query, not the score. Show an actual customer-intent question, something a real prospect might type into ChatGPT or Perplexity, and display the AI's answer both with and without your brand present. This single visual does more work than any chart, because it mirrors the exact buying behaviour leadership recognises from their own AI use.
Map visibility gaps to pipeline stages. Connect "invisible" query clusters to specific products or services with known revenue value. A gap on a low-margin, rarely-searched query matters far less than a gap on the query cluster feeding your highest-value product line.
Use before/after comparisons tied to completed work. If you ran generative engine optimisation or AI SEO improvements during the quarter, show the visibility delta directly attributable to that work rather than letting it blend into a general upward trend.
Translate soft mentions and citation position into plain language. Something like: "We appeared in 34% of relevant AI answers this quarter, up from 19%, putting us ahead of two of three named competitors." That sentence does more for executive comprehension than any underlying data table.
Never present the visibility score as an abstract KPI on its own. Anchor it to a scenario leadership recognises from their own buying behaviour. If they can picture themselves typing that query, they'll trust the number behind it.
It's also worth distinguishing, even briefly, between brand presence and brand accuracy in this section. A company can appear frequently in AI answers while still being described with outdated information, associated with the wrong product line, or compared unfavourably against a competitor. Following the US rollout of Google AI Overviews, users and publishers documented a number of inaccurate generated answers, prompting Google to make technical adjustments. The lesson for your QBR: track the quality and context of appearances, not merely whether your brand shows up.
How to benchmark share of voice against competitors
This is where share of voice earns its place as the headline metric, because raw visibility numbers mean little without a competitive reference point. A side-by-side table pulled directly from MentionOwl's competitor tracking tends to land well in QBR settings, provided it's kept tight.
| Metric | Your Brand | Competitor A | Competitor B | Competitor C |
|---|---|---|---|---|
| Share of voice | 34% | 28% | 22% | 16% |
| Sentiment score | Positive | Neutral | Positive | Negative |
| Citation count (weighted) | 142 | 118 | 95 | 61 |
| Query coverage | 61% | 54% | 49% | 38% |
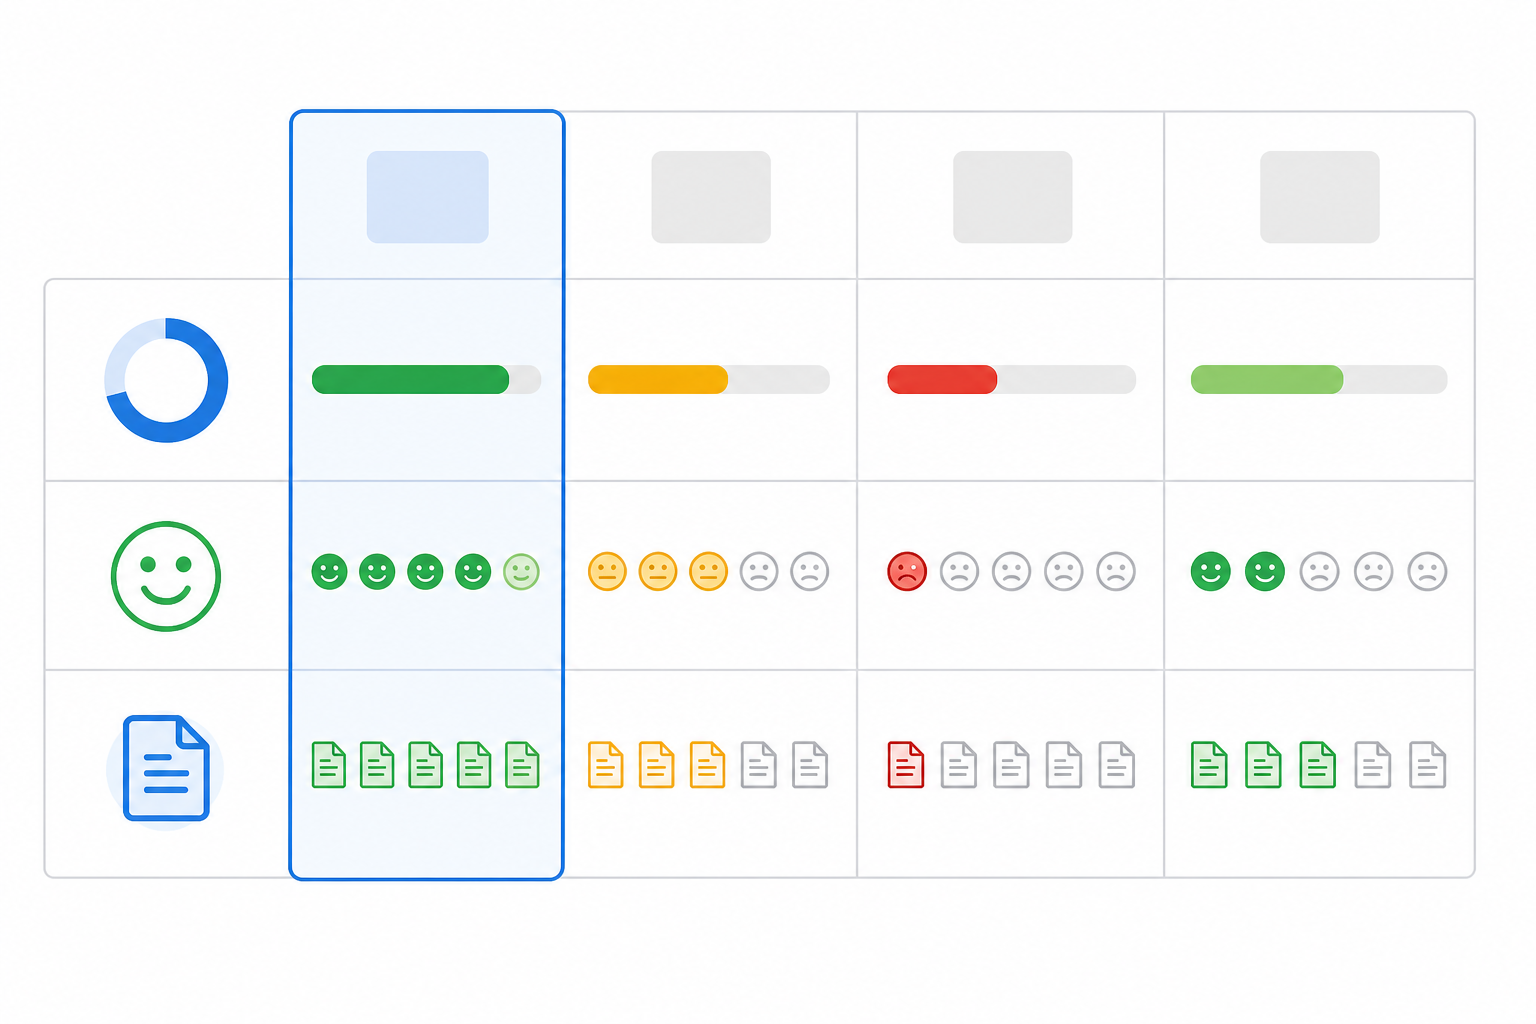
A distinction I'd push leadership to understand, because it's often missed until shown visually, is the difference between being mentioned and being recommended. A competitor might show up in 40% of answers but only as a passing comparison, while your brand appears in 30% of answers with an outright recommendation. Share of voice alone doesn't capture that nuance. Citation position and sentiment do, which is why the sentiment column belongs in this table rather than being treated as a footnote. A competitor with higher share of voice but consistently negative sentiment framing is in a fundamentally different strategic position than one simply outranking you on volume.
On cadence: competitive benchmarking doesn't need to appear in every QBR with the same weight. I'd include a full comparison table when there's been a meaningful shift in share of voice or sentiment worth flagging, and reduce it to a brief line item when the competitive landscape has stayed essentially static. Constant competitor callouts without actual movement dilute urgency and train leadership to tune out the slide entirely. Save the full table for when it tells a story.
How to set AI visibility goals for the next quarter
A QBR that ends on benchmarking without a forward plan leaves leadership with data but no decision to make. I'd close every AI visibility section with a goals framework structured like this:
- Set a specific visibility score target tied to a realistic improvement range based on this quarter's actual trajectory rather than an arbitrary round number. If your score moved from 42 to 51 over the last quarter, targeting 90 next quarter isn't credible; targeting 58–62 is.
- Choose 2–3 priority query clusters where coverage is weakest, and commit to closing the specific legibility gaps identified in your AI legibility audit. MentionOwl's 16 technical checks tend to surface concrete, fixable issues rather than vague recommendations.
- Tie goals to a cadence, with weekly digest reviews handled internally by the marketing team and a formal benchmark check-in scheduled before the next QBR so there are no surprises when leadership asks for an update.
- Align AI visibility goals with existing SEO and content calendars so generative engine optimisation work doesn't become a siloed side project. The content team producing comparison pages or FAQ content for traditional SEO is often producing exactly the material that improves AI query coverage. Coordinate rather than duplicate.
Gartner has also predicted that 30% of outbound marketing messages from large organisations will be synthetically generated, which cuts both ways. It reinforces why your own brand monitoring needs to track how competitors are using AI to shape their content, not only how AI describes you.
AI visibility, share of voice and brand monitoring FAQs
What AI visibility metrics matter most to executives?
In my experience, executives respond best to three numbers: your visibility score trend, your share of voice against named competitors, and sentiment. Everything else, query coverage, citation position, legibility scores, is useful supporting detail, but those three tell the business story fastest.
How do I translate a visibility score into revenue impact?
Map specific query clusters to known purchase-intent stages or product lines, then show the visibility gap on queries tied to your highest-value offerings. A rising score on low-value queries matters less than modest movement on queries directly tied to pipeline.
Should I compare our AI presence to competitors in the QBR?
Yes, but selectively. Include competitive benchmarking when there's a meaningful shift in share of voice or sentiment to report. If the competitive landscape hasn't moved, a brief mention is enough rather than a full comparison table every quarter.
How often should this AI visibility data be refreshed?
I'd pull fresh data within a week of the QBR itself, since AI engines update their training and retrieval patterns frequently. MentionOwl's daily tracking and weekly digests mean you're never presenting numbers more than a few days old.
Related Articles
The AI Legibility Checklist Every E-commerce Site Needs (And Why Most Fail It)
Discover why AI shopping assistants skip most e-commerce sites. This AI legibility checklist walks UK online retailers through 16 technical checks to
Why Agencies Should Offer AI Visibility Monitoring in 2025: The Business Case for a New Retainer
Learn how agencies can turn brand monitoring into an AI visibility retainer with practical deliverables, pricing, tools, and a plan to win clients ear
Create content like this automatically
Scribe uses AI to generate high-quality blog posts that engage your audience and drive traffic.