Content Quality Metrics That Actually Matter for Marketers

Content quality metrics that predict long-term content success
If you've ever stared at a Google Analytics dashboard wondering why a blog post with 10,000 pageviews generated zero leads, you already understand the problem with vanity metrics. They look impressive in a monthly report. They don't tell you whether the content actually did its job.
Here's the short answer: the content quality metrics that actually predict long-term success aren't pageviews or social shares. They're the ones tied to search performance, engagement depth, and business outcomes—organic traffic growth, time on page and scroll depth, conversion rate, and a composite quality score that evaluates structure, SEO, and readability together. If you're a marketing team scaling content production, build your reporting around these five or six numbers rather than drowning in metrics that look good in a screenshot but don't move revenue.
I want to walk through why this shift matters, what each metric actually tells you, and how to build a reporting system that doesn't take up half your week. This matters more as more teams lean on AI content generation to publish faster. Speed without a clear read on quality just means you scale your mistakes faster too.
Vanity metrics vs. content metrics that matter
Let's start with the metrics most teams default to, and why they're not as useful as they feel.
Pageviews tell you how many people landed on a page. They don't tell you if those people were the right people, whether they read past the first paragraph, or whether they did anything valuable once they got there. Social shares are similar. A post can rack up shares because it's provocative or funny, not because it's driving anyone towards a purchase decision. And word count, often used as an informal proxy for effort or depth, has basically no correlation with whether content actually ranks or converts. I've seen 800-word posts outperform 3,000-word ones simply because they answered the question faster.
The problem gets worse when volume becomes the goal itself. If your team (or your content marketing software) is judged on "how many posts went out this month" rather than "how many posts moved the needle," you end up optimising for the wrong thing entirely. This is a real risk once you introduce blog automation into your workflow. Publishing more only helps if what you're publishing performs.

Here's a straightforward way to reframe the comparison:
| Vanity Metric | What It Misses | Pair It With |
|---|---|---|
| Pageviews | Doesn't show engagement or intent | Organic traffic growth (are the right people finding you over time?) |
| Social shares | Doesn't indicate conversion or trust | Time on page and scroll depth |
| Word count | No link to ranking or usefulness | Composite quality score (readability, SEO, structure) |
| Total posts published | Volume isn't value | Conversion rate per post |
| Bounce rate alone | Lacks context (some bounces are fine) | Bounce rate compared against page intent and traffic source |
None of this means pageviews or shares are useless. They're just incomplete on their own. Pair them with a meaningful metric, and suddenly you've got something you can actually act on. This distinction matters more as content production scales. When you're publishing one article a week, you can eyeball quality. When you're publishing daily with the help of an AI writing assistant, you need metrics doing that watching for you.
What does a content quality score measure?
This is where a lot of marketing teams get stuck, because "quality" sounds subjective. It doesn't have to be. A solid quality score breaks down into measurable components, and once you know what they are, scoring content becomes a lot less fuzzy.
Here's what a good composite quality score typically evaluates:
- Readability and structure: Are sentences a reasonable length? Do headings break up the content logically? Does it flow, or does it read like a wall of text? Tools like Flesch-Kincaid give you a starting point, but structure (subheadings, bullet points, short paragraphs) matters just as much as sentence complexity.
- SEO optimisation: This covers keyword relevance, whether the content actually matches search intent, and whether on-page elements (title tags, meta descriptions, header hierarchy, internal links) are doing their job. A page can be beautifully written and still underperform if it doesn't answer what someone actually typed into Google.
- Originality and depth: Does this piece add something competing content doesn't? Or is it a reshuffled version of the top five results for the same keyword? Search engines increasingly reward depth and a distinct point of view over generic coverage.
- Search intent match: Related to SEO but worth calling out separately—is this a "how-to" reader, or someone comparing options, or someone ready to buy? Content that mismatches intent (a product page trying to rank for an informational query, for example) tends to underperform no matter how well it's written.

This is essentially how Scribe's self-improving system works under the hood. Every article we generate gets scored against these factors once it's published, and that data feeds back into the platform. Over time, the system learns which structures, keyword placements, and tones actually correlate with strong performance, and it replicates those patterns while dropping the ones that don't work. It's the same thing a sharp content team does manually, just automated and applied consistently across every post.
One thing worth stressing: quality scoring shouldn't just be a report card you check after publishing. It should inform editorial decisions before content goes live. If a draft scores low on search intent match, that's your cue to rework the angle before it's live, not three months later when you're wondering why it never ranked.
Engagement metrics worth tracking
Once content is published, engagement metrics tell you what's actually happening when someone lands on the page. A few are worth watching closely.
Average time on page gives you a rough sense of whether people are reading or bouncing straight off. It's not perfect (someone could leave a tab open and walk away), but low time on page combined with high traffic usually signals a mismatch between what the headline promised and what the content delivered.
Scroll depth is one of the more underused metrics I'd encourage every team to track. It tells you whether readers are actually reaching your call to action or key argument, or dropping off after the intro. If most readers scroll only 20% down a 2,000-word post, your CTA at the bottom is basically invisible. That's a structural problem, not a traffic problem.
Bounce rate gets a bad reputation because it's often treated as a standalone red flag. Context matters enormously here. A high bounce rate on a quick reference post (like "what time zone is GMT") might be completely normal, because the reader got their answer and left. A high bounce rate on a comparison page meant to drive a purchase decision is a different story entirely.
Return visits and internal navigation show whether your content is building an audience relationship rather than just capturing one-off search traffic. If readers come back, or click through to other posts, that's a strong signal your content strategy is working as a system, not just a collection of individual pages.

These signals become especially valuable once you're publishing at scale through automated publishing. When a human writes and reviews every post individually, you tend to catch quality dips through instinct. When you're generating dozens of articles a month, engagement data is often your earliest warning system. A post that's underperforming on time on page and scroll depth within the first couple of weeks is one worth revisiting before it drags down your average.
Connecting content quality metrics to business outcomes
Traffic and engagement are useful, but they're still a step removed from the question every marketing lead eventually gets asked: is this content making us money?
To answer that, you need to connect content performance to actual business outcomes. That starts with tracking conversions directly attributable to blog content, whether that's a demo booking, a newsletter signup, or a completed purchase. It's also worth tracking assisted conversions, where a blog post played a role earlier in a customer journey that ended in conversion somewhere else. Multi-touch attribution isn't perfect, but even a rough view of which content shows up in converting paths beats ignoring it entirely.

Cost per article is another number worth calculating honestly, especially once blog automation changes your economics. If a freelance writer costs £200 per article and generates modest traffic, but an AI-assisted workflow produces a comparable article for a fraction of the cost and time, that changes your entire content strategy for the better, provided quality holds up. This is exactly why quality scoring and cost efficiency need to be viewed together rather than separately. Cheap content that ranks and converts is a win. Cheap content that nobody finds is just noise at a lower price.
For UK teams specifically, pairing GA4 with Google Search Console gives you a clearer picture than either tool alone. Search Console shows you rankings, impressions, and click-through rates by query, which helps you understand why traffic is moving before it shows up in GA4. Combine that with conversion data, and you can trace a fairly direct line from "we improved this page's search intent match" to "rankings improved" to "conversions increased."
This is roughly the journey behind the 340% organic traffic increase one Scribe customer reported over six months. That number on its own is a headline. What made it meaningful was what happened underneath it: more qualified organic visitors landing on pages built around real search intent, spending longer engaging with the content, and converting at a rate that justified the investment in scaled content production. Traffic growth without that connective tissue to conversions is a vanity metric with better PR.
How to build a simple content metrics dashboard
None of this requires a complicated analytics setup. Here's a practical, five-step approach I'd recommend to any team trying to get this right without burning hours every week.
Pick five to six core metrics. Organic traffic growth, time on page, scroll depth, conversion rate, and a composite quality score covers most of what matters. Resist the urge to track everything just because the data is available. More metrics usually means less clarity, not more.
Set up a single source of truth. Combine GA4 and Search Console data with whatever your CMS or AI writing assistant provides in terms of quality scoring. If these live in three different tabs that nobody checks, they're not actually informing decisions. A simple shared dashboard, even a basic one, beats a sophisticated report nobody opens.
Review quality scores alongside performance data monthly. This is where the two halves of the puzzle come together. A post with a strong quality score but weak performance might point to a targeting issue. A post with a mediocre score but strong performance might mean your scoring criteria need adjusting.
Flag underperforming content for updates or retirement. Not every post needs to live forever. If something has been live for six months with no organic traffic growth and poor engagement, it's either a candidate for a content refresh or a candidate for removal. Both are valid outcomes.
Feed learnings back into your content strategy. This is the step most teams skip. The whole point of tracking these metrics is to change what you produce next, not just to document what happened. This is essentially what Scribe's adaptive learning system does automatically: it looks at which patterns of structure, keyword usage, and tone perform well, replicates them, and retires the approaches that don't. You can build a manual version of this same feedback loop with a monthly review and a shared document of "what's working."

Frequently asked questions about content quality metrics
What metrics show if a blog post is actually good?
A genuinely good blog post combines strong engagement signals (time on page, scroll depth, low bounce rate) with search performance (rankings, organic traffic growth) and business impact (conversions, leads, or sales attributed to that content). No single number tells the full story, which is why we look at quality scoring alongside these performance metrics rather than fixating on one metric like pageviews.
How is content quality scored?
Quality scoring typically evaluates a mix of factors: readability and structure, keyword relevance and SEO optimisation, originality, internal linking, and how well the content matches search intent. Scribe uses a self-improving system that scores every published article against these factors, then learns which patterns of structure, tone, and keyword placement actually drive results, refining future content automatically.
Which analytics matter most for content ROI?
For proving ROI, focus on organic traffic growth over time, conversion rate from content pages, assisted conversions in multi-touch journeys, and cost per published article versus revenue generated. These connect your content marketing efforts directly to business outcomes rather than stopping at surface-level engagement.
How often should marketing teams review content quality metrics?
Monthly is a sensible baseline for most teams, with a deeper quarterly review to spot longer-term trends. If you're scaling content production quickly, such as publishing daily through automated publishing tools, checking quality scores weekly helps you catch dips before they affect your wider search performance.
Related Articles

Content Quality Metrics That Actually Matter for Agencies
Learn content quality metrics agencies use to measure content performance, prove ROI and report results clients value—beyond word count or rankings.
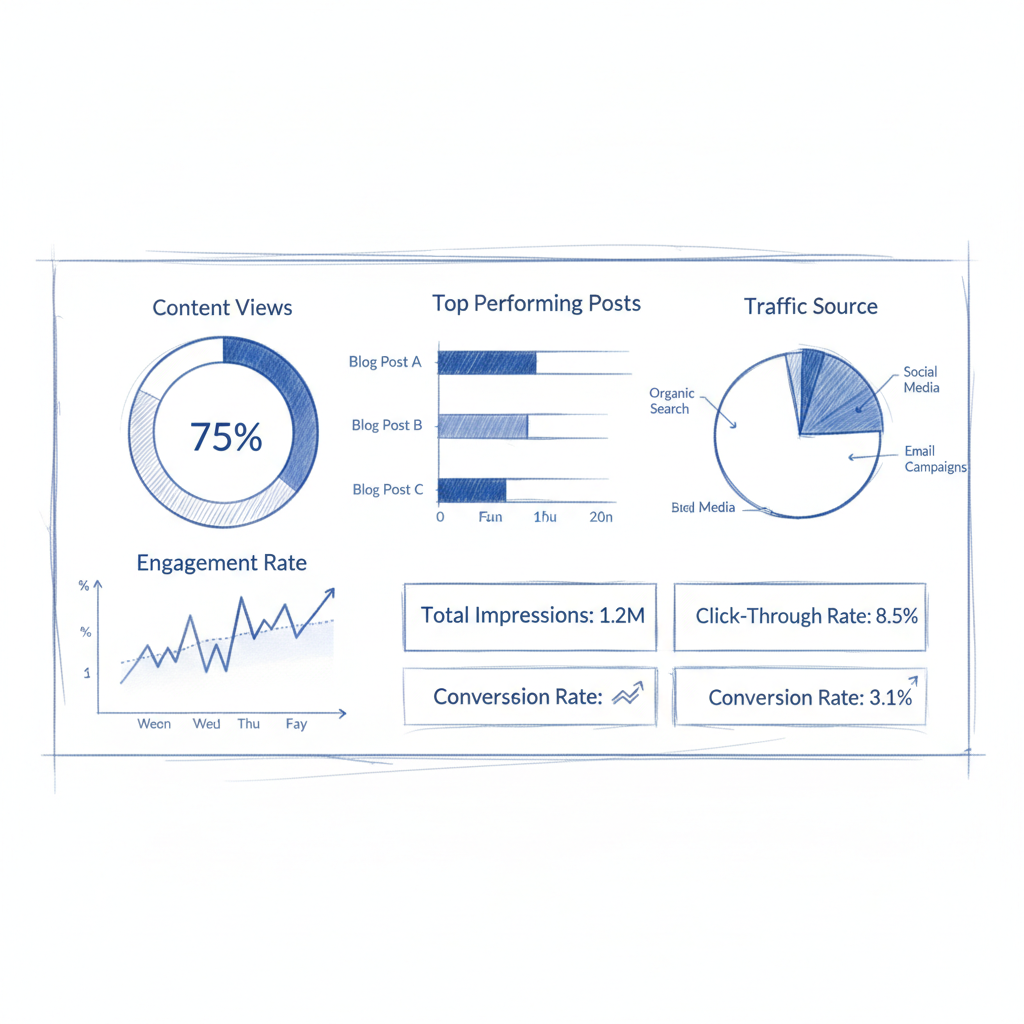
Content Quality Metrics That Drive Measurable Results for Multi-Client Marketing Agencies
Unlock content marketing ROI: Proven metrics that transform vanity stats into revenue-driving strategies for multi-client marketing agencies.

Create content like this automatically
Scribe uses AI to generate high-quality blog posts that engage your audience and drive traffic.