What Ad Frequency Really Tells You About a Competitor's Ad Strategy (And What It Doesn't)
15 min read
Loading...

If you've ever pulled up a competitor's Meta Ad Library or watched their Google Ads activity spike and thought, "Wow, they must be throwing serious budget at that," I want to save you from a costly misread. A jump in active ads doesn't automatically mean a competitor is spending more. It's just as likely to signal active creative testing, a push to avoid audience fatigue, or a short-term seasonal campaign that's about to drop off a cliff. And on the flip side, a thin ad count isn't a sign of a weak strategy either — it can mean a competitor has found a winning creative and is running it efficiently to a tightly defined audience that doesn't need much rotation at all.
Before we go further, I need to clear up some terminology, because getting this wrong is exactly how competitor ad strategy research goes off the rails.
In advertising, frequency technically means the average number of times a reached person sees a specific ad. It's an internal delivery metric — the kind of thing you'd see in your own Meta Ads Manager or Google Ads reporting for your own campaigns. Here's the catch: you cannot see a competitor's true frequency from a public ad library. Meta Ad Library, Google's Ads Transparency Center, TikTok's Creative Center, and LinkedIn's Ad Library show you which ads are currently active — not how often any individual person is seeing them, and not what's being spent behind them.
So what are you actually looking at when you scroll a competitor's ad library and see their count jump from 3 ads to 15? That's active ad count — sometimes called creative volume. It's a genuinely useful signal, but it's a different thing entirely from frequency, and conflating the two leads to bad reads. Here's the quick distinction worth keeping in your back pocket:
Throughout this post, when I talk about a competitor's “ad frequency” spiking, I really mean their active ad count or creative volume — the thing you can actually observe. That's the metric worth building a competitor ad strategy analysis around, as long as you're reading it correctly.
I get why “more ads = more spend” is the default read. It feels intuitive. If a competitor suddenly has 15 active ads instead of 3, surely that means they've opened up the budget taps, right?
Except that's not what a rising ad count actually tells you. A competitor can post a burst of new creative variants simply because they're testing hooks, formats, or offers before committing real spend to a winner. Another competitor running the exact same single ad for six months might be spending far more in total, just without the visual churn that makes their account look “busy.”
This is where raw ad count on its own becomes a vanity metric. It looks impressive in a dashboard, but without context — duration, platform, offer changes, and whether the ads persist week over week — it doesn't tell you anything you can actually act on. As a media buyer, you don't want a number that just looks interesting. You want one that changes what you do next.
When we see a spike in a competitor's active ad count in Rival Ads' weekly diffs, there are several genuinely different explanations behind it — and each one is a hypothesis to test, not a conclusion to jump to. Here's what I'd check for each:
The important thing is that a rising ad count, on its own, doesn't tell you which of these is happening. It's a flag worth investigating — not a story you can write from a single snapshot.

On the other side of the coin, I've seen media buyers write off a competitor as “not really doing much” because their ad count looks thin. That's often exactly the wrong takeaway. A low ad count can mean several things, and none of them are automatically bad news for the competitor:
A caveat worth flagging: a thin ad count in a public library isn't always a full picture either. Some ad formats and placements aren't fully surfaced in every library, account structures vary, and a competitor could simply be running a narrower test than you can see evidence of yet. Don't mistake “quiet in the library” for “quiet in the market” — a competitor sitting on one long-running ad might actually be your biggest threat, precisely because they've already done the testing work and found something that sticks.
Here's where it all comes together. Ad count by itself is half a story. Duration — how long an ad or ad set has actually been live — is the other half. Put them side by side, and you get a genuinely useful strategic read instead of a guess. Note that these are interpretations to investigate further, not guaranteed conclusions — public ad data can't confirm spend or performance on its own.
| Creative Volume | Duration | Possible Interpretation | What to Verify |
|---|---|---|---|
| High | Short | An active testing phase | Check if the pack thins out over the next 2-3 weekly snapshots |
| High | Long | A scaled campaign that's earned its keep | Check if the same offer/landing page persists across the run |
| Low | Short | An early pilot or soft launch | Check for signs of expansion in the following weeks |
| Low | Long | A quiet evergreen winner | Check whether the same ad or angle keeps reappearing after brief pauses |
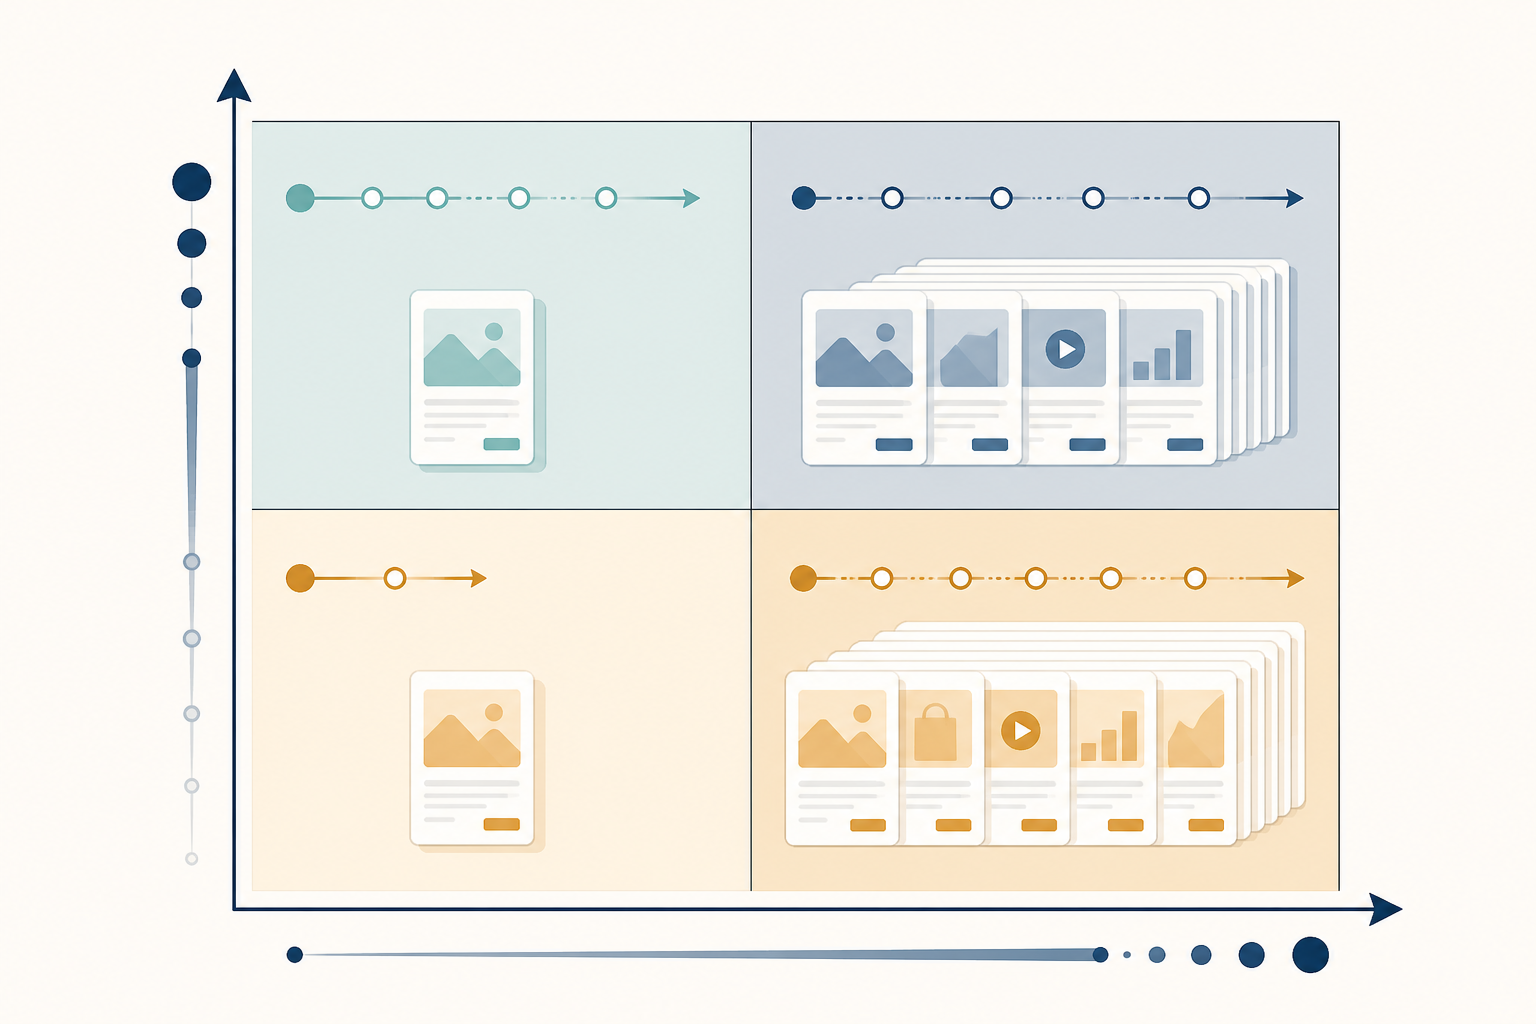
This is the missing context that most surface-level ad spy tools skip entirely. A tool that just shows you “12 active ads” this week isn't giving you a competitor ad strategy read — it's giving you a snapshot with no timeline attached. The moment you can see that those 12 ads have been running steadily for four months, versus popping up three days ago, your entire interpretation shifts.
Let's make this concrete with a hypothetical UK competitor — I'll call them a mid-sized DTC skincare brand, since it's a category I've watched closely.
Monday: Your weekly diff flags that this competitor has gone from 4 active ads to 16 in the space of seven days. Twelve of those sixteen launched within the last five days. My first instinct is testing or a launch — not a budget increase, because a jump in count alone doesn't prove that.
Cross-referencing: Two of the new ads link to a landing page you haven't seen before, featuring a limited-time bundle offer. That's a meaningful clue — it points towards a specific campaign push rather than generic creative testing.
Three weeks later: You check the following snapshots. Thirteen of the sixteen ads have disappeared. Only three remain — including the two pointing to the bundle landing page. That pattern strongly suggests the initial spike was testing, and the bundle offer is what survived the process. It's now been running steadily for three weeks with no new variants added.
The read: This has shifted from “high volume, short duration” to “low volume, medium-to-long duration.” That combination usually means they've found something that's working and are now running it efficiently rather than still hunting for a winner.
The action: Rather than reacting to the initial spike, I'd hold off, keep watching whether that bundle offer keeps running past six weeks, and if it does, consider testing a similar bundle mechanic myself rather than copying the initial 12 test creatives that didn't survive.
For contrast — a competitor running one single ad for eight months straight, with no new variants and no visible bundle or discount changes, is a different story entirely. Low volume, long duration, and no offer churn. That's very likely an evergreen hero ad quietly doing its job. I wouldn't read that as “inactive” — I'd read it as “found their winner and isn't touching it.”
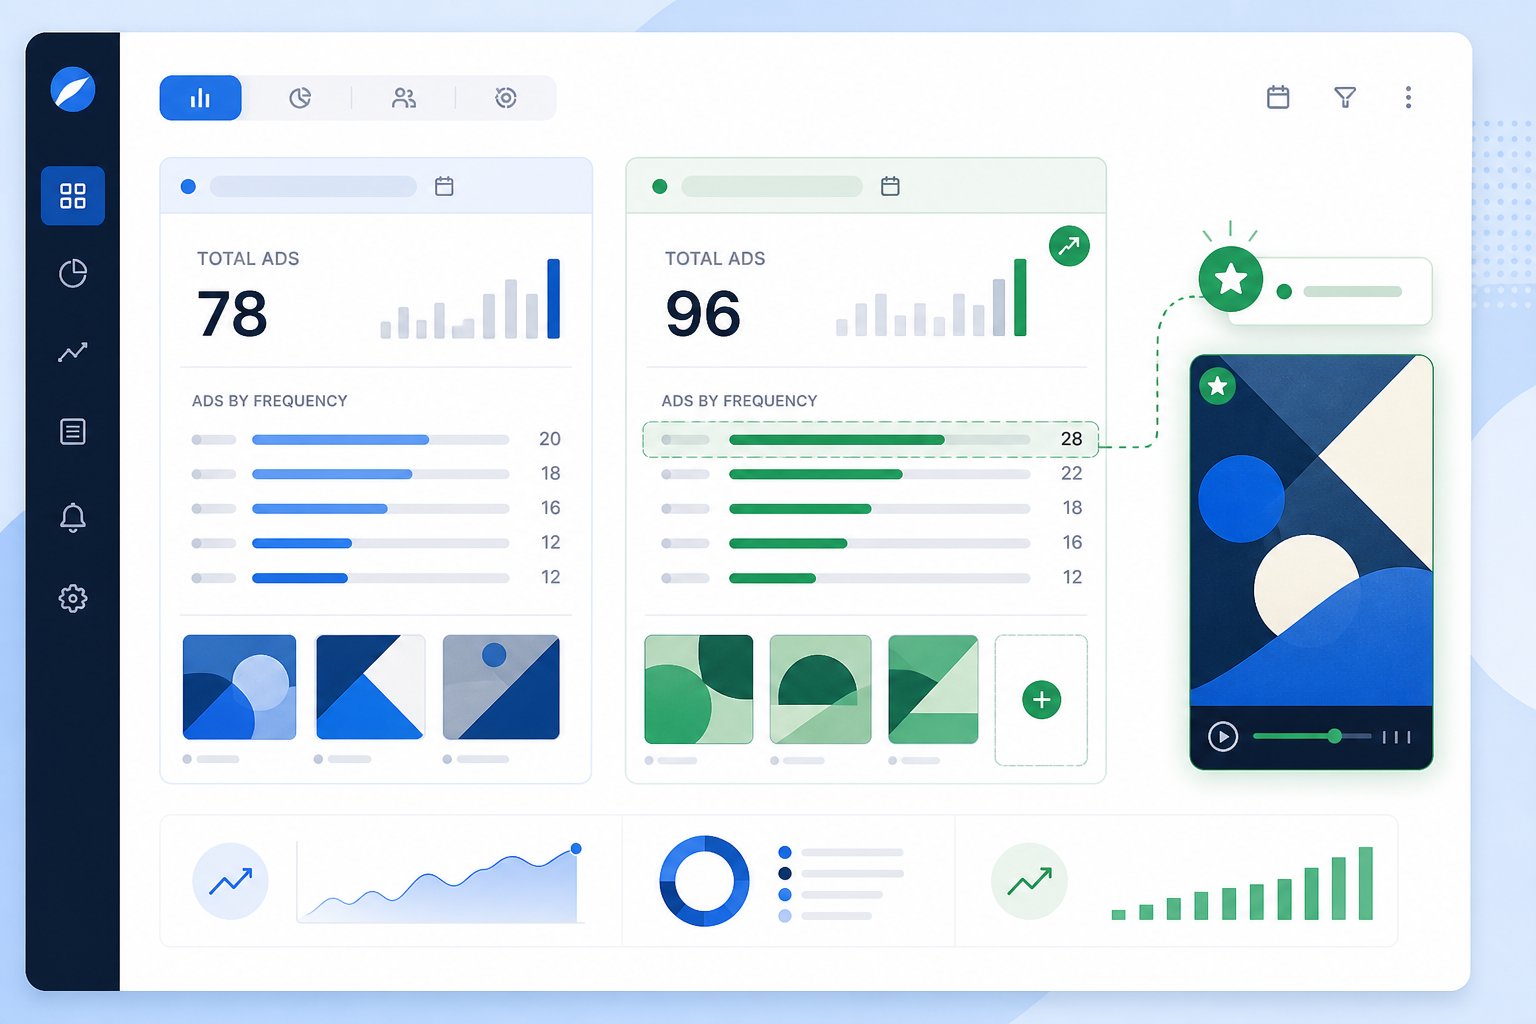
Even with duration in the mix, there are still a few traps worth knowing about, because I've watched sharp media buyers fall into every one of these:
The common thread here is that raw numbers rarely tell the full story on their own. This is exactly why serious competitor ad strategy work means triangulating multiple signals rather than reacting to any single metric in isolation.
Here's the honest truth: manually tracking ad volume and duration across Meta, Google Ads, TikTok, and LinkedIn for even a handful of competitors doesn't scale. I've tried doing this the manual way — screenshotting ad libraries, logging dates in a spreadsheet, and trying to remember what an ad looked like three weeks ago. It's tedious, error-prone, and it falls apart the moment you're tracking more than one or two competitors seriously.
That's the gap we built Rival Ads to close. You give us a competitor's website, and we check for their presence across Meta, Google, TikTok, and LinkedIn, then pull their currently active ads on a weekly basis — the creatives, copy, and links visible in each platform's public library. Our week-over-week diffs surface what's new, what's stopped, and what's continuing to run, so you're not manually re-checking every ad library every time you log in. Worth saying clearly: we're surfacing what's publicly visible on each platform — we can't show you a competitor's actual spend, reach, or delivery frequency, because that data simply isn't public.
We also generate an AI-written summary, powered by Claude, that reads the pattern — creative volume against duration, offer changes against campaign timing — and drafts a starting interpretation along the lines of the hypotheses in this post. It's a helpful first pass that saves you the manual cross-referencing, but it's not a replacement for your own judgement on any given account — I'd always treat it as a starting point to verify, not a final verdict.
This matters most for agencies juggling competitor tracking across multiple client accounts, where there simply isn't time to manually check four ad platforms per client every week. With team collaboration features, competitor assignment, and full whitelabel capability, agencies can build this kind of monitoring directly into what they offer clients — without adding hours of manual work to their week.
Not necessarily, and it's worth being precise here: true ad frequency (how often one person sees an ad) isn't visible in public ad libraries at all. What you're seeing is active ad count. A rising count often points to active creative testing or a rotation strategy to avoid audience fatigue, rather than a bigger budget. To get closer to a spend read, look at how long those ads have run and whether the same offer keeps reappearing across formats.
Read active ad count alongside duration, not on its own. A burst of new ads that disappears within days usually signals testing, while the same creatives running steadily for months usually signals a proven campaign worth watching. Weekly ad intelligence tools that show week-over-week changes make this pattern much easier to spot without manually re-checking each platform yourself.
Frequency is how often one person sees a given ad; reach is how many unique people see it. Neither is directly measurable for a competitor from public ad libraries. What you can observe — active ad count, creative rotation, and duration across platforms — is a proxy that helps you infer their likely strategy, not a direct measurement of either metric.
Weekly tends to work well for most industries — frequent enough to catch testing phases and launches early, without drowning in day-to-day noise that doesn't mean much on its own. That's why Rival Ads delivers weekly diffs and digests rather than real-time alerts that can overwhelm you with insignificant fluctuations.

Learn the exact framework senior media buyers use to interpret weekly ad diffs—what new, stopped, and scaling ads really mean for competitor strategy.

Decode competitor ad spend signals to spot funding, expansion, and strategy pivots early, with a practical ad intelligence framework for CMOs.

Learn how to turn scattered competitor ad copy into a structured messaging map that reveals positioning gaps you can own. A practical, spreadsheet-rea